Franklin Covey Co. (NYSE:FC) is largely controlled by institutional shareholders who own 65% of the company
Every investor in Franklin Covey Co. (NYSE:FC) should be aware of the most powerful shareholder groups. And the group that holds the biggest piece of the pie are institutions with 65% ownership. Put another way, the group faces the maximum upside potential (or downside risk).
Because institutional owners have a huge pool of resources and liquidity, their investing decisions tend to carry a great deal of weight, especially with individual investors. As a result, a sizeable amount of institutional money invested in a firm is generally viewed as a positive attribute.
Let's take a closer look to see what the different types of shareholders can tell us about Franklin Covey.
Check out our latest analysis for Franklin Covey

What Does The Institutional Ownership Tell Us About Franklin Covey?
Institutions typically measure themselves against a benchmark when reporting to their own investors, so they often become more enthusiastic about a stock once it's included in a major index. We would expect most companies to have some institutions on the register, especially if they are growing.
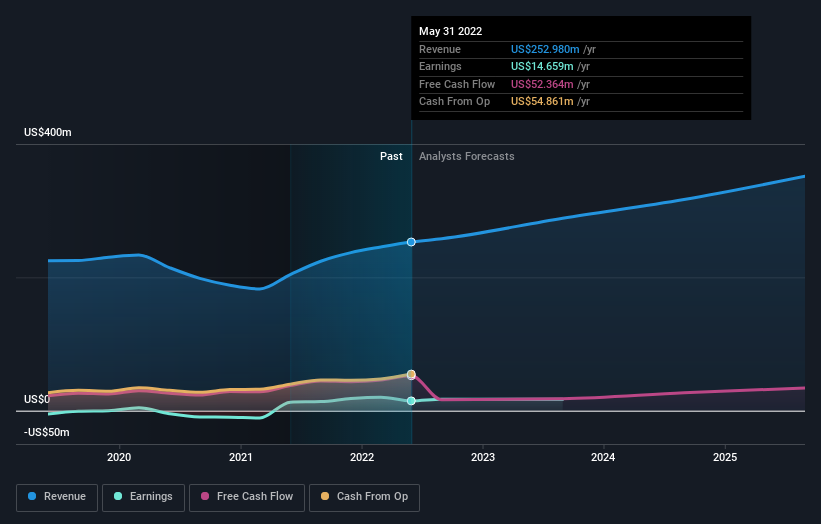
As you can see, institutional investors have a fair amount of stake in Franklin Covey. This implies the analysts working for those institutions have looked at the stock and they like it. But just like anyone else, they could be wrong. If multiple institutions change their view on a stock at the same time, you could see the share price drop fast. It's therefore worth looking at Franklin Covey's earnings history below. Of course, the future is what really matters.
Since institutional investors own more than half the issued stock, the board will likely have to pay attention to their preferences. Hedge funds don't have many shares in Franklin Covey. The company's largest shareholder is BlackRock, Inc., with ownership of 9.3%. For context, the second largest shareholder holds about 5.2% of the shares outstanding, followed by an ownership of 4.6% by the third-largest shareholder.
After doing some more digging, we found that the top 16 have the combined ownership of 50% in the company, suggesting that no single shareholder has significant control over the company.
While studying institutional ownership for a company can add value to your research, it is also a good practice to research analyst recommendations to get a deeper understand of a stock's expected performance. Quite a few analysts cover the stock, so you could look into forecast growth quite easily.
Insider Ownership Of Franklin Covey
While the precise definition of an insider can be subjective, almost everyone considers board members to be insiders. The company management answer to the board and the latter should represent the interests of shareholders. Notably, sometimes top-level managers are on the board themselves.
Insider ownership is positive when it signals leadership are thinking like the true owners of the company. However, high insider ownership can also give immense power to a small group within the company. This can be negative in some circumstances.
It seems insiders own a significant proportion of Franklin Covey Co.. It has a market capitalization of just US$635m, and insiders have US$87m worth of shares in their own names. This may suggest that the founders still own a lot of shares. You can click here to see if they have been buying or selling.
General Public Ownership
With a 22% ownership, the general public, mostly comprising of individual investors, have some degree of sway over Franklin Covey. This size of ownership, while considerable, may not be enough to change company policy if the decision is not in sync with other large shareholders.
Next Steps:
It's always worth thinking about the different groups who own shares in a company. But to understand Franklin Covey better, we need to consider many other factors.
Many find it useful to take an in depth look at how a company has performed in the past. You can access this detailed graph of past earnings, revenue and cash flow.
If you would prefer discover what analysts are predicting in terms of future growth, do not miss this free report on analyst forecasts.
NB: Figures in this article are calculated using data from the last twelve months, which refer to the 12-month period ending on the last date of the month the financial statement is dated. This may not be consistent with full year annual report figures.
Have feedback on this article? Concerned about the content? Get in touch with us directly. Alternatively, email editorial-team (at) simplywallst.com.
This article by Simply Wall St is general in nature. We provide commentary based on historical data and analyst forecasts only using an unbiased methodology and our articles are not intended to be financial advice. It does not constitute a recommendation to buy or sell any stock, and does not take account of your objectives, or your financial situation. We aim to bring you long-term focused analysis driven by fundamental data. Note that our analysis may not factor in the latest price-sensitive company announcements or qualitative material. Simply Wall St has no position in any stocks mentioned.
Join A Paid User Research Session
You’ll receive a US$30 Amazon Gift card for 1 hour of your time while helping us build better investing tools for the individual investors like yourself. Sign up here
