How Do Fraser and Neave, Limited’s (SGX:F99) Returns On Capital Compare To Peers?

Today we are going to look at Fraser and Neave, Limited (SGX:F99) to see whether it might be an attractive investment prospect. To be precise, we’ll consider its Return On Capital Employed (ROCE), as that will inform our view of the quality of the business.
First, we’ll go over how we calculate ROCE. Second, we’ll look at its ROCE compared to similar companies. Then we’ll determine how its current liabilities are affecting its ROCE.
Return On Capital Employed (ROCE): What is it?
ROCE measures the ‘return’ (pre-tax profit) a company generates from capital employed in its business. All else being equal, a better business will have a higher ROCE. In brief, it is a useful tool, but it is not without drawbacks. Author Edwin Whiting says to be careful when comparing the ROCE of different businesses, since ‘No two businesses are exactly alike.’
How Do You Calculate Return On Capital Employed?
Analysts use this formula to calculate return on capital employed:
Return on Capital Employed = Earnings Before Interest and Tax (EBIT) ÷ (Total Assets – Current Liabilities)
Or for Fraser and Neave:
0.031 = S$114m ÷ (S$4.5b – S$776m) (Based on the trailing twelve months to September 2018.)
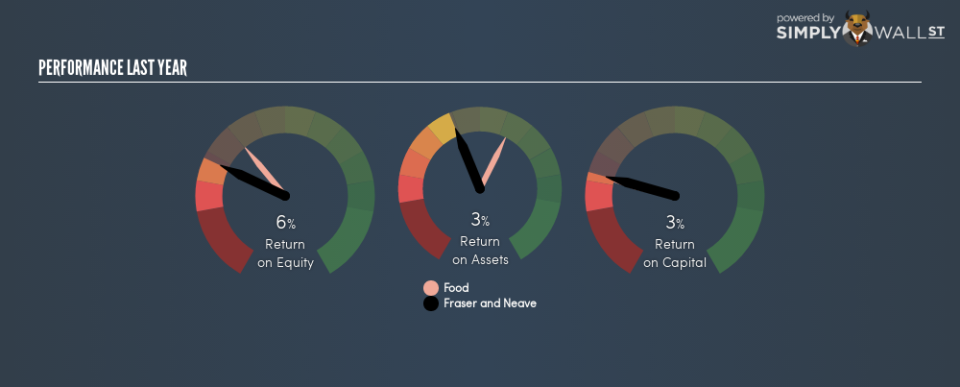
Therefore, Fraser and Neave has an ROCE of 3.1%.
View our latest analysis for Fraser and Neave
Want to help shape the future of investing tools and platforms? Take the survey and be part of one of the most advanced studies of stock market investors to date.
Is Fraser and Neave’s ROCE Good?
When making comparisons between similar businesses, investors may find ROCE useful. We can see Fraser and Neave’s ROCE is meaningfully below the Food industry average of 7.6%. This performance is not ideal, as it suggests the company may not be deploying its capital as effectively as some competitors. Putting aside Fraser and Neave’s performance relative to its industry, its ROCE in absolute terms is poor – considering the risk of owning stocks compared to government bonds. Readers may wish to look for more rewarding investments.
When considering this metric, keep in mind that it is backwards looking, and not necessarily predictive. ROCE can be misleading for companies in cyclical industries, with returns looking impressive during the boom times, but very weak during the busts. ROCE is only a point-in-time measure. Since the future is so important for investors, you should check out our free report on analyst forecasts for Fraser and Neave.
Do Fraser and Neave’s Current Liabilities Skew Its ROCE?
Short term (or current) liabilities, are things like supplier invoices, overdrafts, or tax bills that need to be paid within 12 months. Due to the way the ROCE equation works, having large bills due in the near term can make it look as though a company has less capital employed, and thus a higher ROCE than usual. To check the impact of this, we calculate if a company has high current liabilities relative to its total assets.
Fraser and Neave has total assets of S$4.5b and current liabilities of S$776m. Therefore its current liabilities are equivalent to approximately 17% of its total assets. This is not a high level of current liabilities, which would not boost the ROCE by much.
What We Can Learn From Fraser and Neave’s ROCE
That’s not a bad thing, however Fraser and Neave has a weak ROCE and may not be an attractive investment. Of course, you might find a fantastic investment by looking at a few good candidates. So take a peek at this free list of companies with modest (or no) debt, trading on a P/E below 20.
If you are like me, then you will not want to miss this free list of growing companies that insiders are buying.
To help readers see past the short term volatility of the financial market, we aim to bring you a long-term focused research analysis purely driven by fundamental data. Note that our analysis does not factor in the latest price-sensitive company announcements.
The author is an independent contributor and at the time of publication had no position in the stocks mentioned. For errors that warrant correction please contact the editor at editorial-team@simplywallst.com.
