Who Are Fraser Range Metals Group Limited’s (ASX:FRN) Major Shareholders?

In this analysis, my focus will be on developing a perspective on Fraser Range Metals Group Limited’s (ASX:FRN) latest ownership structure, a less discussed, but important factor. The impact of a company’s ownership structure affects both its short- and long-term performance. Since the same amount of capital coming from an activist institution and a passive mutual fund has different implications on corporate governance, it is a useful exercise to deconstruct FRN’s shareholder registry.
Check out our latest analysis for Fraser Range Metals Group
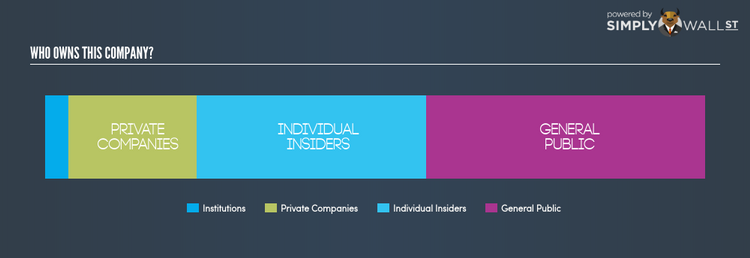
Institutional Ownership
Due to the big order sizes of institutional investors, a company’s shares can experience large, one-sided momentum, driven by high volume of shares removed from, or injected into, the market. With an institutional ownership of 3.63%, FRN doesn’t seem too exposed to higher volatility resulting from institutional trading.
Insider Ownership
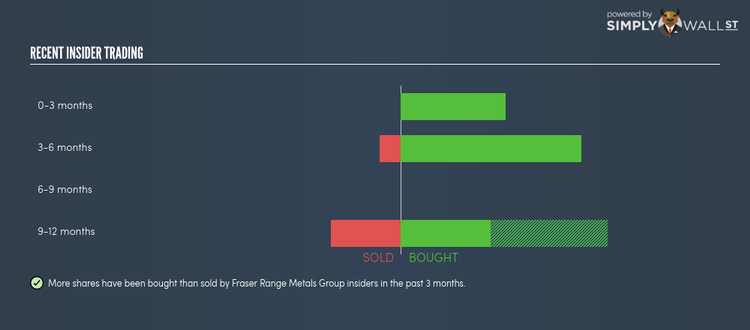
Insiders form another group of important ownership types as they manage the company’s operations and decide the best use of capital. Insider ownership has been linked to better alignment between management and shareholders. A major group of owners of FRN is individual insiders, sitting with a hefty 34.75% stake in the company. Broadly, insider ownership of this level has been found to negatively affect companies with consistently low PE ratio (underperforming). And a positive impact has been seen on companies with a high PE ratio (outperforming). It may be interesting to take a look at what company insiders have been doing with their holdings lately. While insider buying is possibly a sign of a positive outlook for the company, selling doesn’t necessarily indicate a negative outlook as they may be selling to meet personal financial needs.
General Public Ownership
A substantial ownership of 42.16% in FRN is held by the general public. With this size of ownership, retail investors can collectively play a role in major company policies that affect shareholders returns, including executive remuneration and the appointment of directors. They can also exercise the power to decline an acquisition or merger that may not improve profitability.
Private Company Ownership
Another group of owners that a potential investor in FRN should consider are private companies, with a stake of 19.46%. While they invest more often due to strategic interests, an investment can also be driven by capital gains through share price appreciation. With this size of ownership in FRN, this ownership class can affect the company’s business strategy. As a result, potential investors should further explore the company’s business relations with these companies and find out if they can affect shareholder returns in the long-term.
Next Steps:
Institutional ownership level and composition in FRN is not high nor active enough to significantly impact its investment thesis. However, ownership structure should not be the only determining factor when you’re building an investment thesis for FRN. Rather, you should be examining fundamental factors such as the intrinsic valuation, which is a key driver of Fraser Range Metals Group’s share price. I highly recommend you to complete your research by taking a look at the following:
Financial Health: Is FRN’s operations financially sustainable? Balance sheets can be hard to analyze, which is why we’ve done it for you. Check out our financial health checks here.
Past Track Record: Has FRN been consistently performing well irrespective of the ups and downs in the market? Go into more detail in the past performance analysis and take a look at the free visual representations of FRN’s historicals for more clarity.
Other High-Performing Stocks: Are there other stocks that provide better prospects with proven track records? Explore our free list of these great stocks here.
NB: Figures in this article are calculated using data from the last twelve months, which refer to the 12-month period ending on the last date of the month the financial statement is dated. This may not be consistent with full year annual report figures.
To help readers see pass the short term volatility of the financial market, we aim to bring you a long-term focused research analysis purely driven by fundamental data. Note that our analysis does not factor in the latest price sensitive company announcements.
The author is an independent contributor and at the time of publication had no position in the stocks mentioned.
