How Has Fu Yu Corporation Limited’s (SGX:F13) Earnings Fared Against The Long Term Trend

For investors with a long-term horizon, examining earnings trend over time and against industry peers is more insightful than looking at an earnings announcement in one point in time. Investors may find my commentary, albeit very high-level and brief, on Fu Yu Corporation Limited (SGX:F13) useful as an attempt to give more color around how Fu Yu is currently performing.
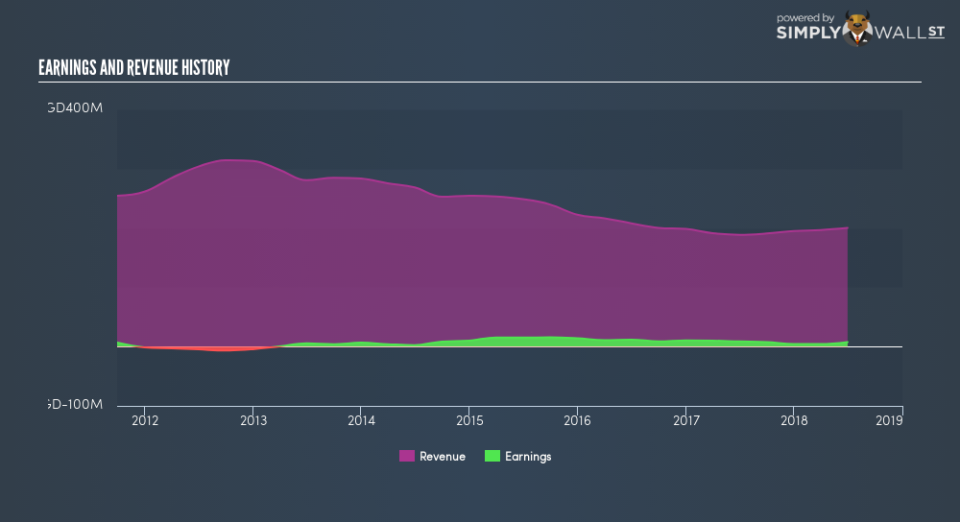
View our latest analysis for Fu Yu
Did F13 perform worse than its track record and industry?
F13’s trailing twelve-month earnings (from 30 June 2018) of S$7.8m has declined by -10.4% compared to the previous year. Furthermore, this one-year growth rate has been lower than its average earnings growth rate over the past 5 years of 23.1%, indicating the rate at which F13 is growing has slowed down. What could be happening here? Well, let’s take a look at what’s going on with margins and if the entire industry is facing the same headwind.
In the last few years, revenue growth has failed to keep up with earnings, which indicates that Fu Yu’s bottom line has been driven by unsustainable cost-cutting. Scanning growth from a sector-level, the SG machinery industry has been enduring some headwinds over the past year, leading to an average earnings drop of -16.0%. This is a momentous change, given that the industry has constantly been delivering a a solid growth of 14.0% in the past five years. This growth is a median of profitable companies of 12 Machinery companies in SG including COSCO Shipping International (Singapore), Darco Water Technologies and Acma. This suggests that any near-term headwind the industry is facing, Fu Yu is relatively better-cushioned than its peers.
In terms of returns from investment, Fu Yu has fallen short of achieving a 20% return on equity (ROE), recording 5.4% instead. Furthermore, its return on assets (ROA) of 2.8% is below the SG Machinery industry of 5.5%, indicating Fu Yu’s are utilized less efficiently. And finally, its return on capital (ROC), which also accounts for Fu Yu’s debt level, has declined over the past 3 years from 10.0% to 7.2%.
What does this mean?
Fu Yu’s track record can be a valuable insight into its earnings performance, but it certainly doesn’t tell the whole story. Companies that are profitable, but have volatile earnings, can have many factors affecting its business. I suggest you continue to research Fu Yu to get a better picture of the stock by looking at:
Future Outlook: What are well-informed industry analysts predicting for F13’s future growth? Take a look at our free research report of analyst consensus for F13’s outlook.
Financial Health: Are F13’s operations financially sustainable? Balance sheets can be hard to analyze, which is why we’ve done it for you. Check out our financial health checks here.
Other High-Performing Stocks: Are there other stocks that provide better prospects with proven track records? Explore our free list of these great stocks here.
NB: Figures in this article are calculated using data from the trailing twelve months from 30 June 2018. This may not be consistent with full year annual report figures.
To help readers see past the short term volatility of the financial market, we aim to bring you a long-term focused research analysis purely driven by fundamental data. Note that our analysis does not factor in the latest price-sensitive company announcements.
The author is an independent contributor and at the time of publication had no position in the stocks mentioned. For errors that warrant correction please contact the editor at editorial-team@simplywallst.com.
