Fundamentals Support Low Volatility, Tight Spreads (Capital Market Research) (Weekly Market Outlook)

WEEKLY
MARKET OUTLOOK
APRIL 29, 2021
CAPI TAL MARKETS RESEARCH
Moody’s Analytics markets and distributes all Moody’s Capital Markets Research, Inc. materials. Moody’s Capital Markets Research, Inc. is a subsidiary of Moody’s Corporation. Moody’s
Analytics does not provide investment advisory services or products. For further detail, please see the last page.
Fundamentals Support Low Volatility, Tight
Spreads
Credit Markets Review and Outlook
by Ryan Sweet
»
FULL STORY PAGE 2
The Week Ahead
We preview economic reports and forecasts from the U.S. , Europe and Asia/Pacific regions.
»
FULL STORY PAGE 5
The Long View
Full updated stories and
key credit market metrics:
High-yield corporate bond
issuance is on track to
have another strong
month.
»
FULL STORY PAGE 10
Ratings Round-Up
Upgrades for 10 of 11 U.S. Changes; Europe Activity Shows Improvement
»
FULL STORY PAGE 13
Market Data
Credit spreads, CDS movers, issuance.
»
FULL STORY PAGE 16
Moody’s Capital Markets Research
recent publications
Links to commentaries on: Leverage, stimulus, inflation, GDP, Treasury yields, rising prices,
core profits, yield spreads, virus, Congress , misery, issuance boom, default rate, volatility,
credit quality, record savings rates, demographic change, high tech, complacency, Fed
intervention, speculation, risk, credit stress, optimism, corporate credit, VIX.
»
FULL STORY PAGE 20
Credit
Spreads
Investment Grade: Year-end 2021’s average investment grade
bond spread may be near its recent 97 basis points. High Yield:
Even with a booming economy, a composite high-yield spread
could be slightly higher than its recent 326 bp by year-end
2021.
Defaults
US HY default rate: According to Moody's Investors Service,
the U.S. ' trailing 12-month high-yield default rate jumped
from March 2020’s 4.9% to March 2021’s 7.5% but may
average only 4.1% for 2021’s final quarter.
Issuance
For 2019’s
offerings of US$-denominated corporate bonds,
IG bond issuance rose 2.6% to $1.309 trillion , while high-
yield bond issuance surged by 58% to $440 billion .
In 2020, US$-denominated corporate bond issuance soared
54% for IG to a record $2.012 trillion , while high-yield
advanced 30% to a record-high $570 billion .
For 2021, US$-denominated corporate bond offerings may
decline 16% (to $1.684 trillion ) for IG and increase 7% (to
$607 billion ) for high-yield, where both forecasts top their
respective annual averages for the five years ended 2020 of
$1.494 trillion for IG and $410 billion for high-yield.
Moody’s
Analytics Research
Contributors:
Lead Author
Ryan Sweet
Senior Director-Economic Research
610-235-5213
Ryan.Sweet@Moodys.com
Asia-Pacific
Katrina Ell
Economist
Shahana Mukherjee
Economist
Europe
Ross Cioffi
Economist
U.S.
Adam Kamins
Economist
Michael Ferlez
Economist
Ryan Kelly
Data Specialist
Editor
Reid Kanaley
Click here for
Moody’s Credit
Outlook, our sister publication
containing Moody’s rating
agency analysis of recent news
events, summaries of recent
rating changes, and summaries
of recent research.
Contact:

CAPI TAL MARKETS RESEARCH
2
APRIL 29, 2021
CAPITAL MARKETS RESEARCH / MARKET OUTLOOK / MOODYS.COM
Credit Markets
Review and Outlook
Credit Markets Review and Outlook
By Ryan Sweet, Senior Director-Economic Research
Fundamentals Support Low Volatility, Tight Spreads
Tight U.S. high-yield corporate bond spreads could stick around until the economy begins to cool or volatility
in the equity market increases. The VIX is currently trading around 18, below its historical average of 19.5 and
below the 20 to 30 range it was trading in since the second half of last year. Volatility could return as a debt-
ceiling fight could brew this summer, potential for the Fed altering its forward guidance around its monthly
asset purchases, and proposed capital gains tax hikes, which could ding the stock market later this year.
For now, volatility isn’t out of line with economic fundamentals. To estimate the level of the VIX consistent
with fundamentals, we model the monthly average of the VIX using an ordinary least squares regression.
Independent variables include the GDP-weighted average of the ISM surveys, the TED spread, a dummy
variable for recessions, and U.S. economic policy uncertainty. The TED spread is the difference between the
three-month T-bill rate and the three-month Libor.
The results were in line with our a priori, as all the coefficients had the expected sign. All were statistically
significant and had an adjusted R-squared of 0.6. The regression was re-estimated, but we replaced U.S.
economic policy uncertainty with global policy uncertainty. The assumption is that uncertainty abroad would
affect volatility in U.S. equity markets. However, the results showed this explained less of the variation in the
VIX than U.S. policy uncertainty.
Overall, the VIX isn’t out of line with fundamentals, thus the tight spreads for high-yield corporate bonds seem
reasonable. To highlight this, we modeled the high-yield corporate bond spread in terms of the average
expected default frequency metric of U.S. /Canadian high-yield issuers, the VIX, and the moving three-month
average of the Chicago Fed’s national activity index. This suggests that the high-yield corporate bond spread is
a little too narrow, but nothing that raises a red flag.
High-yield corporate bond issuance is on track to have another strong month. Also, returns in high-yield have
been solid. Year-to-date returns by quality distribution show that among the biggest gains are in high-yield.
For example, year-to-date returns for Caa is 4.7% while Ca is over 15%.
Q1 GDP Is Even Better than It Appears
U.S. real
rose 6.4% at an annualized rate in the first quarter, a little lighter than our forecast for a 7.1%
gain. The economy is about to close the output gap, a small milestone on the road to fully recovering from the
recession. The output gap, or the difference between actual GDP and potential output as a share of GDP, was -
2.5% in the first quarter of this year. The output gap could close in the next quarter or two. This is a rapid
closing of the output gap, which was -10% in the teeth of the recession. Aggressive fiscal and monetary policy
stimulus played a critical role.

CAPI TAL MARKETS RESEARCH
3
APRIL 29, 2021
CAPITAL MARKETS RESEARCH / MARKET OUTLOOK / MOODYS.COM
Credit Markets
Review and Outlook
Fiscal stimulus impact is all over first quarter GDP. Real consumer spending jumped 10.7% at an annualized
rate, compared with the 2.3% gain in the prior three months. This is among the largest increases since the
1960s. The strength in consumer spending isn’t surprising because of the 61.3% annualized gain in disposable
income in the first quarter. Disposable income got a big boost from government transfer payments, including
economic impact payments that boosted incomes by $1.929 trillion at an annualized rate. Expanded
unemployment programs also added $275 billion at an annualized rate.
Though economic impact payments will fade, consumers are sitting on an enormous amount of savings that
will decline as restrictions continue to be relaxed. The amount of saving that households have done since the
pandemic began, using the Bureau of Economic Analysis measure of saving, compared with what would have
been saved at pre-pandemic saving rates, suggests excess saving of about $1.6 trillion as of the end of last year
and probably well over $2 trillion today given two rounds of stimulus checks distributed this year. We will
update our estimate of excess savings Friday after the release of March personal income.
Real business fixed investment increased 10.1% at an annualized rate after rising 18.6% in the fourth quarter of
last year. Nonresidential structures investment continues to decline, having fallen each quarter since the
recession began. Real equipment spending was up 16.7% at an annualized rate in the first quarter, a solid gain
even though it trails the 25.4% in the final three months of last year. There was good news on the future
productivity growth front as intellectual property investment rose 10.1% at an annualized rate, exceeding 10%
for the second consecutive quarter.
Still, it will take time to reap all the benefits. A Granger causality test found evidence that growth in
intellectual property causes changes in productivity with a 16-quarter lag. Therefore, if the relationship
between investment in intellectual property and productivity holds, productivity growth should reaccelerate
over the next couple of years.
Real residential investment increased 10.8% at an annualized rate. Homebuilders haven’t been able to keep up
with demand. Demand should remain strong as more millennials are moving into their first-time homebuyer
years.
Inventories subtracted 2.6 percentage points from first quarter GDP. Some of this is likely attributed to supply
chain disruptions and the global semiconductor shortage. As this fades, businesses will need to replenish
inventories, which will be a positive for manufacturing and GDP.
The monetary policy implications of first-quarter GDP are not significant. The Fed continues to stress that the
economy is still far away from its objectives. We may need to raise our forecast for GDP growth this year. The
April baseline had GDP rising 6.4% this year but could exceed our forecast given the amount of excess savings
and need to replenish inventories GDP.
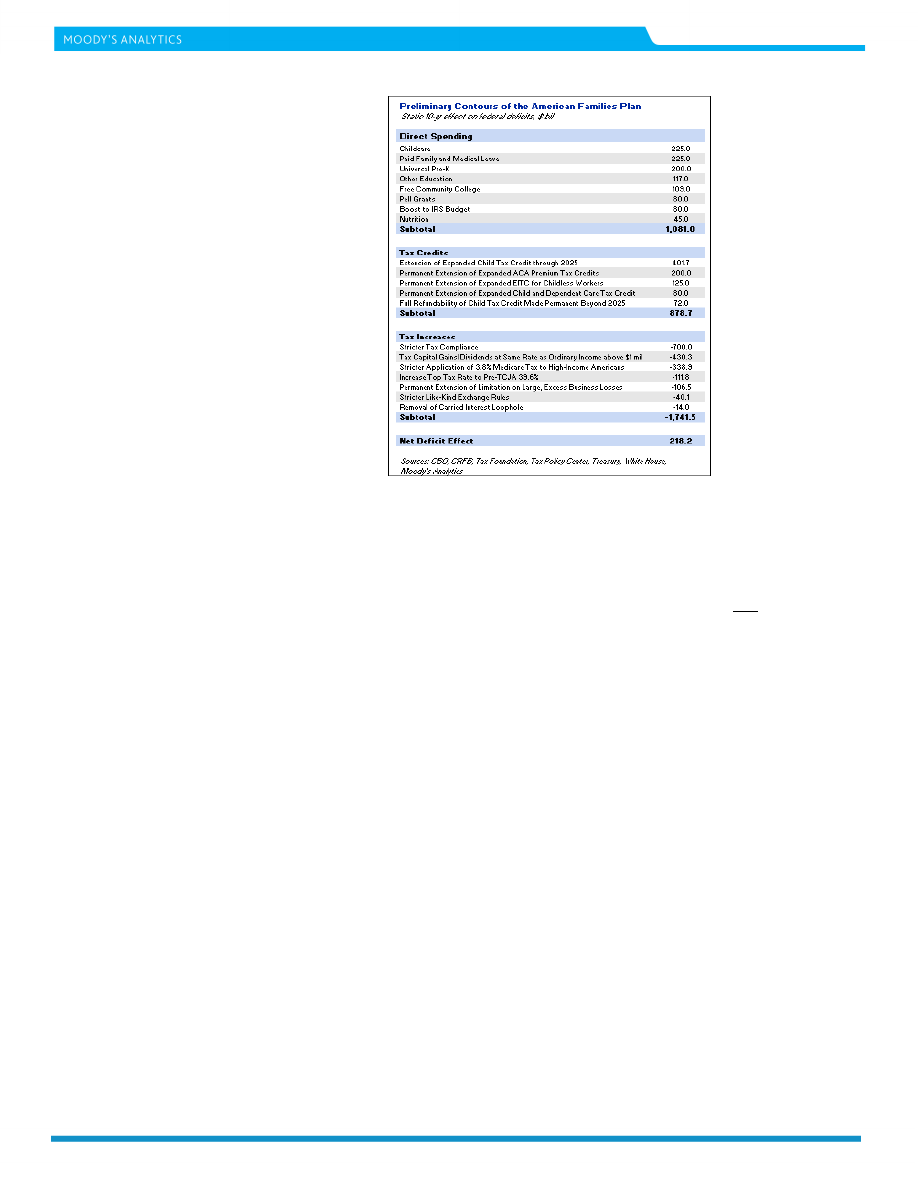
First Take on the American Families Plan
We have come up with a preliminary cost estimate of the AFP, based on the fact sheet provided by the White
House and other sources.
CAPI TAL MARKETS RESEARCH
4
APRIL 29, 2021
CAPITAL MARKETS RESEARCH / MARKET OUTLOOK / MOODYS.COM
Credit Markets
Review and Outlook
The AFP contains $1.1 trillion in direct federal outlays over the next 10 years. Half of this amount is attributable
to education spending, namely: universal pre-K, free community college, and an increase to the maximum Pell
Grant award, among others. The other half would go toward a variety of ends such as childcare, paid family
and medical leave, and expanded nutrition assistance to children.
The other source of fiscal support under the AFP would be about $900 billion in additional tax expenditures
over the next decade. The AFP would extend the expansions that the American Rescue Plan temporarily made
to a handful of tax credits. For the 2021 tax year, the ARP increased the Child Tax Credit from $2,000 to a fully
refundable $3,600 per child 5 years old and younger and to $3,000 per child between 6 and 17 years old. The
AFP would extend this CTC expansion through 2025 but would make the full refundability of the CTC
permanent, costing nearly $500 billion over the next 10 years. The ARP also expanded the premium tax credit,
which lowers out-of-pocket premiums for lower-income individuals acquiring health insurance through the
marketplaces established by the Affordable Care Act. The AFP would make the expansion of the premium tax
credit permanent. Temporary expansions to the Earned Income Tax Credit and the Child and Dependent Care
Tax Credit under the ARP would also be made permanent.
Finally, the AFP calls for an estimated $1.7 trillion in higher taxes on well-to-do households. Of this amount,
the White House assumes $700 billion would come from greater tax compliance by the wealthiest taxpayers.
This estimate seems to be based on recent research by economists Natasha Sarin and Larry Summers, who
argue that greater tax compliance efforts by the IRS could generate more than $1 trillion in revenue over the
next decade. In addition, the AFP would raise the top marginal tax rate on individuals to 39.6% from 37% and
would tax capital gains and dividends as the same rate as ordinary income for households making more than
$1 million . It would also end a handful of loopholes and tax breaks that disproportionately benefit the
wealthiest taxpayers.
All told, the AFP would increase the deficit by a net $200 billion over the next 10 years but would be fully paid
for over 15 years.
The Week Ahead
CAPI TAL MARKETS RESEARCH
5
APRIL 29, 2021
CAPITAL MARKETS RESEARCH / MARKET OUTLOOK / MOODYS.COM
The Week Ahead – U.S., Europe, Asia-Pacific
THE U.S.
By Adam Kamins of Moody’s Analytics
Vaccine Uptake Is Showing Its Positive Effects
Robust payroll gains nationally in March translated into encouraging figures for the vast majority of
U.S. states and metro areas. In fact, all but one state added jobs over the course of last month and
about 90% of metro economies moved in the right direction over the same period.
A deeper dive into these figures, provides an encouraging window into a set of regional recoveries that
is growing more uniform as herd immunity draws closer and reopenings become more widespread. But
there remain some regional differences, and variation across states reveals the degree to which
incidence still matters. Still, subtle shifts are also noticeable when looking at March figures, perhaps
representing one more sign that the pandemic has entered a new phase.
Digging into the state data
One of the more noticeable aspects of the March payroll data is the fact that few regions actually
stand out. For the first time since July, all but one state (Alaska) experienced job gains. But this time,
that was achieved while U.S. employment increased by about half as many jobs as it did in the early
summer months.
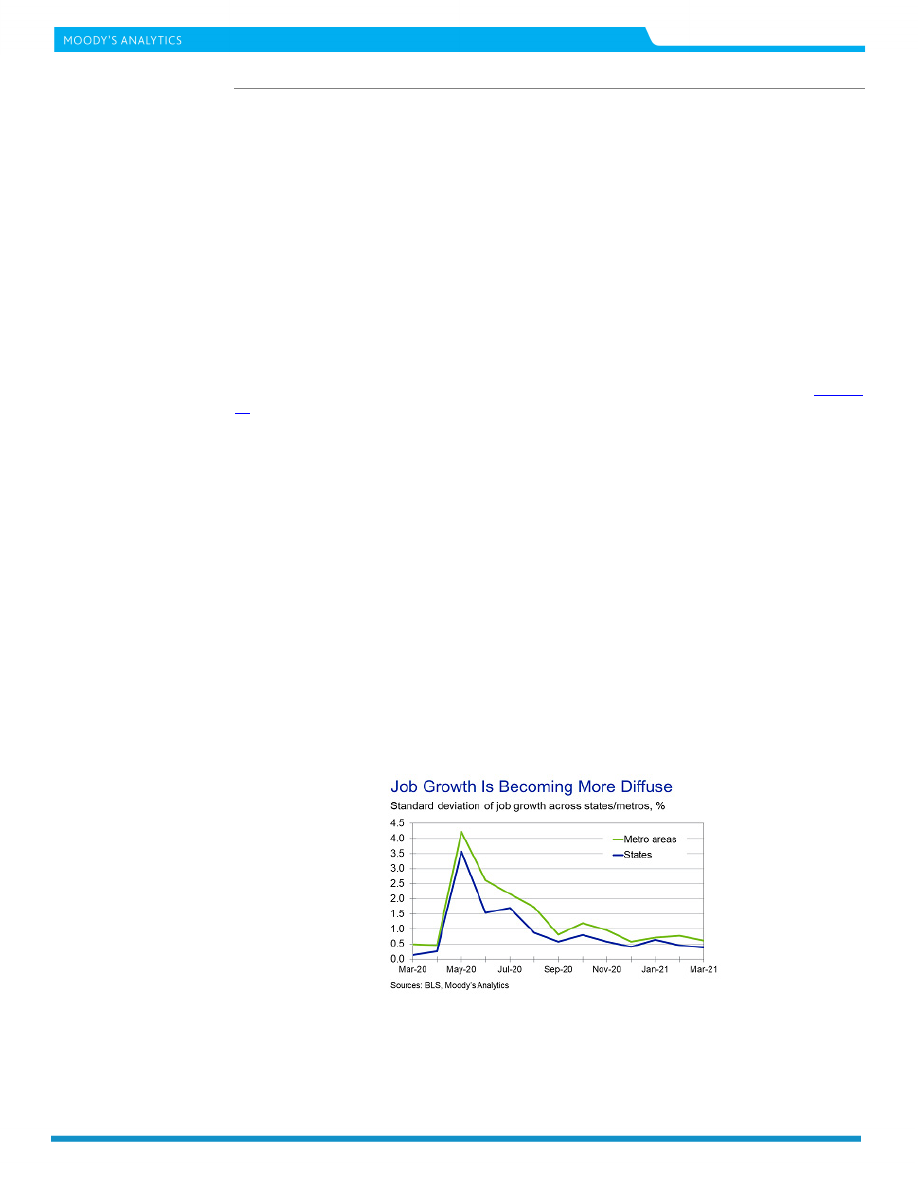
Put it together and it signals that variation across state and metro area economies is diminishing. With
each state generally making a small contribution to overall growth in March, the national economy
increasingly appears to reflect the case of a rising tide lifting all boats. This is also evident when
calculating the standard deviation of job growth across states, which is easily its lowest since March
2020, when the effects of COVID-19 were only starting to trickle into the data.
The trend is even more pronounced at a metro area level. The standard deviation of growth across
metros is not only its lowest of the past year, but below February 2020’s figure. In other words, job
growth is now occurring more evenly across metro area economies than it was even in the last
“normal” month before the pandemic.
Still, within that context, some trends stand out. Oregon and New Mexico led the way from February
to March, a notable turnaround for two states that enacted some of the earliest and most stringent
autumn lockdowns. To some extent, this likely reflects a lower base, but the decisive move in the right
direction also signals that their mitigation measures have been at least partially effective.

The Week Ahead
CAPI TAL MARKETS RESEARCH
6
APRIL 29, 2021
CAPITAL MARKETS RESEARCH / MARKET OUTLOOK / MOODYS.COM
Generally, states that have ramped up their vaccination efforts seem to be picking up the pace a bit
more dramatically. New York and New Jersey in particular improved as more businesses reopened,
residents grew more comfortable, and spending increased. Of course, the March data largely reflect the
re-entry of priority groups such as healthcare workers, seniors, and those with risk factors into the
economy. This may set the stage for continued gains in the months ahead in places where demand for
the vaccine is sufficient to confer something close to herd immunity.
Still, COVID-19 has the potential to wreak havoc. Nowhere is this more pronounced than in Michigan,
where job growth from February to March was subpar and the decline in last month’s growth rate from
the average over the preceding two months was steeper than in any other metro area. This coincides
with a surge in new cases, two factors that are undoubtedly related.
Understanding the drivers
Anecdotally, it seems clear that reopenings, vaccinations, and new COVID-19 cases all made a
difference in March. So in order to more precisely quantify what was behind last month’s numbers, a
series of regressions were run.
The regressions used standardized z-scores (based on each state’s relative distance from the mean) to
account for February to March job growth, the increase in per capita COVID-19 cases, and new
vaccinations per resident. In addition, structural factors such as growth in prior months and the depth
of the initial decline in employment were considered.
The case count was based on the average over the first two weeks of the month, to account for a slight
lag between an outbreak and the reaction from businesses and consumers. And the vaccination rate
considered the share of residents who were fully vaccinated on average over the first week of March
compared with a month earlier.
Based on a sample of 50 states plus Washington DC, and using variables to control for both the
previous month’s job growth and the decline from March to May of last year, the only relationship that
even came close to statistical significance was between job growth and new cases. This was somewhat
surprising based on the importance of both recent performance and early job losses in each state’s
monthly performance. But it reinforces the notion that COVID-19 remains central to the economic
narrative, albeit far less than it did for most of last year.
A surprising vaccine finding
Replacing the vaccination rate variable with a measure that looks at the share of residents who received
their first vaccine dose, as opposed to both doses, changes the results noticeably. The change in the
percentage who received their first shot displayed a positive, statistically significant relationship with
February to March growth despite the fact that only one inoculation does not provide immunity for the
two most widely distributed vaccines.

The Week Ahead
CAPI TAL MARKETS RESEARCH
7
APRIL 29, 2021
CAPITAL MARKETS RESEARCH / MARKET OUTLOOK / MOODYS.COM
There are a few possible explanations for this surprising result. Of course, it could simply represent
statistical noise, reflecting the fact that states that were closed for longer but had more success
vaccinating residents performed better. But the fact that the coefficient on the January to February and
spring 2020 employment changes are generally insignificant at least lends some credence to the notion
that there is something else underlying this result.
Other explanations could entail residents beginning to venture out with one vaccine. Even if they are
not yet fully immune, some may feel a level of protection and begin to re-engage—albeit cautiously—
by spending more on leisure, doing things like going out to eat again, or enrolling children in activities
that increase parents’ productivity and provide a local economic boost.
Similarly, businesses may interpret rising vaccination rates as an encouraging sign. We are already
seeing some evidence of this in several survey-based measures of forward-looking sentiment. With the
end of the pandemic starting to come into view, firms may be starting to hire a bit more aggressively,
especially in hard-hit consumer industries. This could also be contributing to payroll gains that are
stronger in states with more first doses.
Finally, pandemic fatigue could be playing a role. While restrictions were largely lifted in much of the
country early this year, more cautious states and cities have been awaiting evidence of reduced
infections. While cases have not fallen sharply yet, new positive tests have plateaued in most of the
nation, which may be enough to embolden otherwise-cautious elected officials to relent.
In all likelihood, these results reflect a combination of multiple effects. Combine this with the reality
that it is exceedingly difficult for leaders and individuals to put the proverbial genie back in the bottle
once residents have a taste of normalcy and the idea of payrolls backtracking again in the months
ahead seems increasingly far-fetched as lockdowns become a thing of the past.
Evolving drivers
Of course, the relationship among these drivers has evolved over the past year. Early on, the course of
the disease overwhelmed any other factor, and by mid-summer rank orders had largely reversed with
more severe declines giving way to somewhat more robust rebounds in harder-hit states. By autumn,
outbreaks in the upper Midwest were not as economically damaging given many states’ defiance of
medical guidelines, but most evidence suggested that new cases still made a dent in growth.
Early this year, new cases still mattered, with the January to February change showing the same type of
borderline-significant negative relationship that exists in the February to March period. But some
rebound pressures mattered as well, with the March to May 2020 decline a significant predictor of the
one-month delta in employment in February before its relevancy faded last month.
Not surprisingly, early in the rollout the vaccines were not having much impact, either with respect to
share of residents who received one or both doses. It was only in March that the vaccine effect showed
evidence of supplanting the bounce associated with rebounding from a lower trough.
This noticeable shift from one month to the next means that the April job growth figures will bear close
watching. Theoretically, vaccination rates should hold the key to stronger growth in the months ahead.
One can expect that this relationship will solidify further in the months to come—but with hesitancy
taking a toll and new variants raging, that story has yet to be written.
Next Week
The employment report for April, due next Friday, will garner a lot of attention on the heals of March
job gains, and as the recovery continues to takes hold. March saw employment surge 916,000 as the
unemployment rate fell. Recent improvement in initial jobless claims continued in the latest period as
applications for benefits fell for a third consecutive week. April new-vehicle sales should reflect
continued strength. Other key data will include construction spending, factory orders and wholesale
trade.

The Week Ahead
CAPI TAL MARKETS RESEARCH
8
APRIL 29, 2021
CAPITAL MARKETS RESEARCH / MARKET OUTLOOK / MOODYS.COM
EUROPE
By Ross Cioffi of Moody’s Analytics
Industrial Production on the Rise
Retail and industrial production in March are at the center of attention in next week’s important
releases. The Bank of England will also announce its monetary policy decision for May. Euro zone retail
sales likely increased just 0.2% m/m in March after a 3% jump in February. March’s sales were likely
weighed down as lockdowns tightened across the bloc to deal with a new wave of COVID-19
infections. Sales will recoil after the temporary rebound in February, but food sales likely sustained the
growth rate.
We expect industrial production picked up again in March in Germany, France and Spain. As producers
restocked, they were able to start production again. We are forecasting a 1.7% m/m increase in
Germany and a 2% rise in France. However, base effects will start weighing heavily in year-ago
calculations, since the first wave of the pandemic hit this time last year. As a result, we are expecting a
7.5% y/y increase in Spain’s industrial production. Although we are expecting a return to growth in
March, supply shortages remain an issue, so we aren’t betting on a massive rebound just yet. Downside
risks are prevalent. Further, the ongoing supply disruptions throughout March, culminating in the
blockage at the Suez Canal promise an underwhelming April release.
Finally, Russia’s consumer price index will likely rise 5.7% for April. Rising commodity prices and a weak
ruble are keeping price pressures high. The Central Bank of Russia is in a difficult position. It wants to
keep financial conditions accommodative but needs to fight the rise in inflation. The CBR hiked the
interest rate 50 basis points to 5% at its April meeting.
Key indicators
Units
Moody's Analytics
Last
Mon @ 8:00 a.m.
Germany: Retail Sales for March
% change
0.3
1.2
Thur @ 11:00 a.m.
Euro Zone: Retail Sales for March
% change
0.2
3.0
Thur @ 1:00 p.m.
U.K.: Monetary Policy and Minutes for May
%
0.1
0.1
Fri @ 8:00 a.m.
Germany: Industrial Production for March
% change
1.7
-1.6
Fri @ 8:45 a.m.
France: Industrial Production for March
% change
2.0
-4.7
Fri @ 9:00 a.m.
Spain: Industrial Production for March
% change yr ago
7.5
-2.1
Fri @ 10:00 a.m.
Italy: Retail Sales for March
% change
-0.5
6.6
Fri @ 5:00 p.m.
Russia: Consumer Price Index for April
% change yr ago
5.7
5.8

The Week Ahead
CAPI TAL MARKETS RESEARCH
9
APRIL 29, 2021
CAPITAL MARKETS RESEARCH / MARKET OUTLOOK / MOODYS.COM
Asia-Pacific
By Katrina Ell of Moody’s Analytics
Japan raises GDP estimate despite COVID-19 surge
The Bank of Japan expectedly kept the short-term interest rate target steady at -0.1% in April and the
10-year bond yield target at around 0%. What was surprising, was that the central bank struck a
slightly more optimistic tone at its April policy meeting. GDP growth for fiscal 2021, which began on 1
April, was upwardly revised to 4%, from the prior 3.9% estimate. This is astonishing given that the
country's largest prefectures reintroduced emergency restrictions on 25 April following a spike in local
COVID-19 infections.
From 25 April to 11 May, restaurants and bars will be closed and large sporting events will be held
without spectators. This will further hurt the dented consumption and service sectors, with the
restrictions set to occur during Golden Week, when a spike in retail trade usually occurs. These
prefectures represent almost 25% of Japan’s population of 126 million. Japan had been out of its prior
state of emergency for only a month. It has struggled to contain local infections, and its vaccination
drive has been relatively slow, with only 0.7% of the population having received both shots.
This puts added pressure on Japan's export-facing sectors to pick up the slack left by the larger-than-
anticipated dent to domestic demand that will eventuate in the June quarter. Although exports have
performed well of late, export demand is not enough to completely offset the renewed weakness at
home. Seasonally adjusted exports rebounded in March with a 4.5% expansion, following the 4.8%
contraction in February. Japan's export engine performed well in the final months of 2020, and that
was a key driver of its better-than-expected December-quarter GDP data.
The Bank of Japan's inflation forecast for fiscal 2021 was released as 0.1% year over year, down from
0.5% for fiscal 2020. This confirms that the Bank of Japan's 2% target for stable prices will not be
achieved in the foreseeable future, meaning that the elusive goal of creating an environment where
prices, wages and spending are rising remains out of reach.
Key indicators
Units
Moody's Analytics Confidence Risk
Last
Tues @ 9:00 a.m.
South Korea CPI for April
% change yr ago
2.0
2
1.5
Tues @ 11:30 a.m.
Australia Foreign Trade for March
A$ bil
5.3
3
7.5
Tues @ 2:30 p.m.
Australia Monetary Policy for May
%
0.1
4
0.1
Wed @ 2:00 p.m.
Indonesia GDP for Q1
% change yr ago
1.9
2
-2.2
Wed @ 5:05 p.m.
Thailand Monetary Policy for May
%
0.5
4
0.5
Fri @ 1:00 p.m.
China Foreign Trade for April
US$ bil
22.9
3
13.8
Fri @ 6:00 p.m.
Taiwan Foreign Trade for April
US$ bil
3.4
2
3.7

10
APRIL 29, 2021
CAPITAL MARKETS RESEARCH / MARKET OUTLOOK / MOODYS.COM
CAPI TAL MARKETS RESEARCH
The Long View
d
The Long View
High-yield corporate bond issuance is on track to have another strong
month.
By Ryan Sweet, Senior Director-Economic Research
April 29, 2021
CREDIT SPREADS
As measured by Moody's long-term average corporate bond yield, the recent investment grade corporate
bond yield spread of 97 basis points, down 1 basis point from last week. This is below its high over the past 12
months of 179 bp and a hair above its low of 95 bp. Still, the investment grade corporate bond yield is lower
than its 116 bp median of the 30 years ended 2019. This spread may be no wider than 112 bp by year-end
2021.
The recent composite high-yield bond spread of 326 bp approximates what is suggested by the
accompanying long-term Baa industrial company bond yield spread of 136 bp but is narrower than what
might be inferred from the recent VIX of 18 points.
DEFAULTS
March 2021’s U.S. high-yield default rate of 7.5% was up from March 2020’s 4.9%. The recent average high-
yield EDF metric of 1.9% portend a less-than-3% default rate by 2021’s final quarter.
U.S. CORPORATE BOND ISSUANCE
First-quarter 2020’s worldwide offerings of corporate bonds revealed annual advances of 14% for IG and 19%
for high-yield, wherein US$-denominated offerings increased 45% for IG and grew 12% for high yield.
Second-quarter 2020’s worldwide offerings of corporate bonds revealed annual surges of 69% for IG and
32% for high-yield, wherein US$-denominated offerings increased 142% for IG and grew 45% for high yield.
Third-quarter 2020’s worldwide offerings of corporate bonds revealed an annual decline of 6% for IG and an
annual advance of 44% for high-yield, wherein US$-denominated offerings increased 12% for IG and soared
upward 56% for high yield.
Fourth-quarter 2020’s worldwide offerings of corporate bonds revealed an annual decline of 3% for IG and an
annual advance of 8% for high-yield, wherein US$-denominated offerings increased 16% for IG and 11% for
high yield.
First-quarter 2021’s worldwide offerings of corporate bonds revealed an annual decline of 4% for IG and an
annual advance of 57% for high-yield, wherein US$-denominated offerings sank 9% for IG and advanced 64%
for high yield.
U.S. ECONOMIC OUTLOOK
We expect real GDP to rise 6.4% this year, compared with the 5.7% in our March and 4.9% in our February
baselines. We have been consistently revising our forecast higher for GDP this year because of changes to our
fiscal policy assumptions. GDP is expected to rise 5.3% next year, weaker than the 5.7% in the February baseline.
The higher corporate tax rate will bite a little bit into the economy next year, but its drag is in basis points, not
percentage points.
The unemployment rate is expected to average 4.55% in the fourth quarter of this year, compared with 5% in
the March baseline. The unemployment rate averages 3.9% in the fourth quarter of next year, 30 bp lower than
in the prior baseline.
The 10-year Treasury is now expected to average 2% in the fourth quarter of this year, compared with the
1.77% in the March baseline.

11
APRIL 29, 2021
CAPITAL MARKETS RESEARCH / MARKET OUTLOOK / MOODYS.COM
CAPI TAL MARKETS RESEARCH
The Long View
d
Europe
By Ross Cioffi of Moody’s Analytics
April 29, 2021
SWEDEN
’s economy surpassed expectations, growing by 1.1% q/q in the first quarter of 2021. This is only a
preliminary estimate, but it is in line with the upbeat releases of the country’s main macro series. There is still no
decomposition, but we suspect that net exports and private consumption contributed substantially to quarterly
growth. GDP in March drove the quarter’s increase, speeding ahead by 2.1% m/m after a more modest
performance in January and February.
Thanks to the global recovery, external demand was strong during the first quarter, spurring Sweden’s large
manufacturing sector. The view from the domestic economy was also encouraging. Judging by retail sales, the
consumer economy was able to tread water, even if the services side remained painfully stifled by social distancing
practices. Despite the increase in Sweden’s GDP, our expectations for the euro zone release, due out tomorrow, are
more subdued. Sweden benefited from its lack of lockdown and its sectoral make-up: Consumer-facing services
contribute less to total gross value added, while export-oriented capital and intermediate goods producers play
larger roles.
Although the year-on-year growth rate was unchanged in the first quarter, implying that GDP recovered to its year-
ago level, we are not celebrating a full recovery just yet. There are still downside risks looking ahead to the second
quarter. Supply channels have been hard pressed in 2021, as global demand recovers but butts up against global
productive and transport capacity, which are still curbed by the pandemic. Such supply-side disruptions are driving
up producers’ costs and postponing deliveries of inputs. This will delay production schedules and could show up in
the spring accounts as weaker output. That said, when these disruptions ease, a period of make-up growth will
follow. The net effect will be to shift growth from the second to the third and fourth quarters.
EURO ZONE
Loan growth in the euro zone was still on an upward trend in March. During the month, loans to households
increased by 3.3% y/y, speeding up from 3% growth in February. Loans to companies increased by 5.3%, slowing
from 7% growth in the month before. Consensus expectations were for a stronger year-on-year growth rate to
companies, but we are not worried about the slower growth rate, as it is not a sign that monetary conditions are
tightening. Base effects are behind the slowdown. And considering how large the increase in corporate lending was
in March, April and May of 2020, a 5.3% growth rate, which is still well above pre-pandemic trends, is a testament
to how accommodative financing conditions still are.
On a similar note, the M3 money supply increased by 10.1% y/y in March to €14.7 trillion. The growth rate slowed
from 13.3% y/y in February but was considerably higher than the 5% average growth registered in 2019.
GERMANY
German consumers lost confidence heading into May, according to the GfK consumer confidence index, which slid
to -8.8 from -6.1. The loss of confidence comes as lockdown measures were tightened in Germany amidst the third
wave of the COVID-19 pandemic. Whereas in April hopes ran high that lockdowns would be ending soon, the fact
that daily infections are still swelling, making a speedy loosening of restrictions unlikely, discouraged German
consumers.
Income expectations tumbled heading into May. This was due to the retail sector in particular, which continues to
see its reopening pushed back. The good news, however, is that the indicator reflecting individuals’ propensity to
buy increased. Lockdowns may have been extended, but pent-up consumer demand continues to build. Fiscal
policies such as short-time work schemes are keeping a floor under incomes and adding job security. Meanwhile,
the manufacturing sector continues to recover, bolstering incomes and jobs. All this means that even as the general
view on the economy remains grim, consumers will be able to spend once shops reopen. It is this post-lockdown
spending spree that will kickstart the recovery.

12
APRIL 29, 2021
CAPITAL MARKETS RESEARCH / MARKET OUTLOOK / MOODYS.COM
CAPI TAL MARKETS RESEARCH
The Long View
d
Asia Pacific
By Katrina Ell of Moody’s Analytics
April 29, 2021
CHINA
’s foreign trade surplus likely widened in April, after narrowing to US$13.8 billion in March. China’s
exports will remain elevated in year-over-year terms due to low base effects as the pandemic wreaked havoc
on foreign demand. But beyond that, pent-up foreign demand is expected to ease over the year, particularly
for audio and video equipment and parts, lighting devices, and furniture. Factories have reopened in many
major economies, and their domestic manufacturing is picking up speed, squeezing demand on China’s
exports. The domestic market will play a more important role in digesting and supporting production this
year, backing import growth and likely keeping the trade balance relatively narrow.
The surge in China’s imports in March was largely due to rising prices. The import volume of refined oil and
pharmaceutical products slipped compared with December, but their import value soared by more than 35%.
This is common across most import products, creating further evidence of global inflation.
AUSTRALIA
On the policy front, the Reserve Bank of Australia will keep all monetary settings on hold in May. Now is not
the time to scale back the unprecedented level of monetary support that was introduced at the height of the
COVID-19 outbreak last year. While the economy is certainly on the path to recovery, it is far from being back
at pre-pandemic levels. We can observe this most clearly in the labour market, where underemployment
remains relatively high and wage growth subdued. The RBA does not expect to see inflation back in the 2% to
3% range along with wage growth being substantially higher until 2024 at the earliest.
The property market is a growing area of concern for the central bank, specifically concerned about ensuring
that lending standards are maintained in this sustained low interest rate environment. If the housing market
continues to heat up, we will see action from the regulator, likely via targeted measures such as loan-to-value
restrictions, to ensure that lending standards are not wavering with the cheap availability of money.
In the near term, there are risks to Australia's still-fragile economic recovery. A key risk is via the withdrawal of
the wage subsidy scheme, JobKeeper, at the end of March, which could trigger a temporary pullback in
spending in the second quarter and weaken the pace of the labour market revival. The magnitude of the
pullback is unlikely to be severe, though it will add to near-term labour market slackness.
13
APRIL 29, 2021
CAPITAL MARKETS RESEARCH / MARKET OUTLOOK / MOODYS.COM
CAPI TAL MARKETS RESEARCH
Ratings Round-Up
Ratings Round-Up
Upgrades for 10 of 11 U.S. Changes; Europe Activity Shows Improvement
By Michael Ferlez
April 29, 2021
U.S. corporate credit quality remained strong last week. For the period ending April 27, upgrades accounted
for ten of the eleven changes and all the affected debt. Rating changes were spread across numerous
industries, with speculative-grade companies accounting for the bulk of rating changes. The period’s most
notable upgrade was made to Caterpillar Inc. On April 21, Moody’s Investors Service upgraded the long-term
and short-term ratings of Caterpillar Inc., Caterpillar Financial Services Corporation, and their supported
affiliates to A2 and Prime-1 respectively. In their rating action, Moody Investors Service cited higher returns
CAT will generate throughout the business cycle. Moody’s also said it anticipates that CAT’s core operation
should be able to maintain EBITA margins over 10% during downturns.
Both the European rating change activity and the composition of changes improved from the prior period.
Upgrades accounted for six of the nine changes and roughly 86% of affected debt. The United Kingdom led
with three rating changes. The period’s largest upgrade was made to HeidelbergCement AG, which saw its
long-term issuer rating and senior unsecured rating upgraded to Baa2 and its senior unsecured medium-term
note program upgraded to (P)Baa2. In addition, Moody’s Investors Service upgraded the several ratings
related to HeidelbergCement Finance Luxembourg S.A. In the rating action, Vitali Morgovski, a Moody's
assistant vice president-analyst and lead analyst for HeidelbergCement AG, was cited saying, "Our decision to
upgrade HC's ratings reflects its resilient performance throughout 2020 with stronger than anticipated credit
metrics at the end of the year that are well commensurate with the Baa2 rating requirements. We believe the
ongoing economic recovery with a healthy level of construction activity together with HeidelbergCement
AG's focus on cash flow generation will allow sustaining these levels in coming years. The group's more
conservative financial policy including reduced leverage target with a focus on predominantly organic growth
objectives provides further comfort.” The rating change affected $9.2 billion in debt.
.
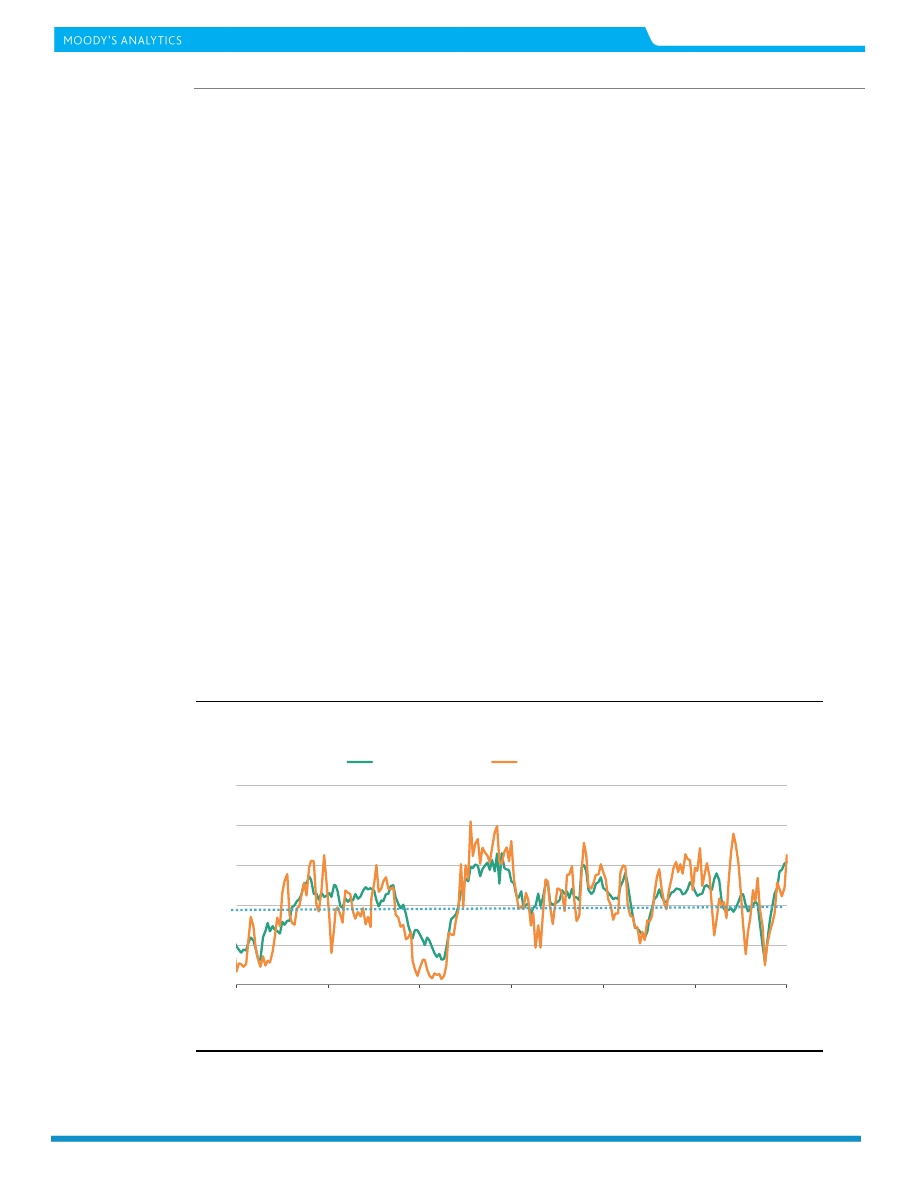
FIGURE 1
Rating Changes - US Corporate & Financial Institutions: Favorable as % of Total Actions
0.0
0.2
0.4
0.6
0.8
1.0
0.0
0.2
0.4
0.6
0.8
1.0
Feb02
Apr05
Jun08
Aug11
Oct14
Dec17
Feb21
By Count of Actions
By Amount of Debt Affected
* Trailing 3-month average
Source: Moody's

14
APRIL 29, 2021
CAPITAL MARKETS RESEARCH / MARKET OUTLOOK / MOODYS.COM
CAPI TAL MARKETS RESEARCH
Ratings Round-Up
FIGURE 2
Rating Key
BCF
Bank Credit Facility Rating
MM
Money-Market
CFR
Corporate Family Rating
MTN
MTN Program Rating
CP
Commercial Paper Rating
Notes
Notes
FSR
Bank Financial Strength Rating
PDR
Probability of Default Rating
IFS
Insurance Financial Strength Rating
PS
Preferred Stock Rating
IR
Issuer Rating
SGLR
Speculative-Grade Liquidity Rating
JrSub
Junior Subordinated Rating
SLTD
Short- and Long-Term Deposit Rating
LGD
Loss Given Default Rating
SrSec
Senior Secured Rating
LTCF
Long-Term Corporate Family Rating
SrUnsec
Senior Unsecured Rating
LTD
Long-Term Deposit Rating
SrSub
Senior Subordinated
LTIR
Long-Term Issuer Rating
STD
Short-Term Deposit Rating
FIGURE 3
Rating Changes: Corporate & Financial Institutions – US
Date
Company
Sector
Rating
Amount
($
Million)
Up/
Down
Old LTD
Rating
New
LTD
Rating
O
l
d
S
IG/S
G
4/21/21 CATERPILLAR INC.
Industrial
SrUnsec/LTIR/MTN/
CP
35,340
U
A3
A2
IG
4/21/21 OLD DOMINION ELECTRIC COOPERATIVE
Utility
SrSec
550
U
A2
A1
IG
4/21/21 ALLIED UNIVERSAL HOLDCO LLC
Industrial
SrSec/SrUnsec/SrSec
/BCF/LTCFR/PDR
2,990
U
B3
B2
SG
4/21/21 MEDICAL DEPOT HOLDINGS, INC.
Industrial
SrSec/BCF/LTCFR/P
DR
U
Caa2
Caa1
SG
4/22/21
ALLETE, INC.-SUPERIOR WATER, LIGHT AND POWER
COMPANY
Industrial
LTIR
D
A3
Baa1
IG
4/22/21 POPULAR, INC.
Financial SrUnsec/LTIR/STD/L
TD/MTN/PS
1,567
U
B1
Ba3
SG
4/22/21 CONN'S, INC.
Industrial
LTCFR
U
B2
B1
SG
4/22/21 EXCEL FITNESS HOLDINGS, INC.
Industrial SrSec/BCF/LTCFR/P
DR
U
Caa1
B3
SG
4/23/21
PENN NATIONAL GAMING, INC. (OLD)-PENN
NATIONAL GAMING, INC.
Industrial
SrSec/BCF
400
U
B1
Ba3
SG
4/26/21 APPLIED MATERIALS INC.
Industrial
SrUnsec/CP
5,500
U
A3
A2
IG
4/26/21 UNIVAR N.V. -UNIVAR SOLUTIONS INC.
Industrial
SrUnsec/SrSec/BCF/
LTCFR/PDR
500
U
Ba3
Ba2
SG
Source: Moody's

15
APRIL 29, 2021
CAPITAL MARKETS RESEARCH / MARKET OUTLOOK / MOODYS.COM
CAPI TAL MARKETS RESEARCH
Ratings Round-Up
FIGURE 4
Rating Changes: Corporate & Financial Institutions – Europe
Date
Company
Sector
Rating
Amount
($ Million)
Up/
Down
Old LTD
Rating
New
LTD
Rating
Country
4/21/2021 HEIDELBERGCEMENT AG
Industrial SrUnsec/LTIR/
9,217.9
U
Baa3
Baa2
GERMANY
4/21/2021 POLYUS GOLD INTERNATIONAL LIMITED-
POLYUS FINANCE PLC
Industrial SrUnsec
1,757.9
U
Ba1
Baa3
UNITED KINGDOM
4/21/2021 BFF BANK S.P.A.
Financial SrUnsec/LTIR/
361.5
D
Ba1
Ba2
ITALY
4/23/2021
CODERE S.A. -CODERE FINANCE 2
(LUXEMBOURG) S.A.
Industrial SrSec/LTCFR/
1,203.7
D
Caa3
Ca
LUXEMBOURG
4/23/2021
EAGLE SUPER GLOBAL HOLDING B.V .-
EAGLE INTERMEDIATE GLOBAL HOLDING
B.V.
Industrial SrSec/LTCFR/
991.2
U
Caa2
Caa1
NETHERLANDS
4/26/2021 DAKAR FINANCE S.A.-PARTS EUROPE S.A. Industrial SrSec/LTCFR/
1,065.2
U
Caa1
B3
FRANCE
4/26/2021 FERROGLOBE PLC
Industrial PDR
U
Ca
Caa1
UNITED KINGDOM
4/27/2021
CENTRAL NOTTINGHAMSHIRE
HOSPITALS PLC
Industrial SrSec
487.0
D
Baa3
Ba1
UNITED KINGDOM
4/27/2021 VERALLIA S.A.
Industrial LTCFR
U
Ba3
Ba2
FRANCE
Source: Moody's
16
APRIL 29, 2021
CAPITAL MARKETS RESEARCH / MARKET OUTLOOK / MOODYS.COM
CAPI TAL MARKETS RESEARCH
Market Data
Market Data
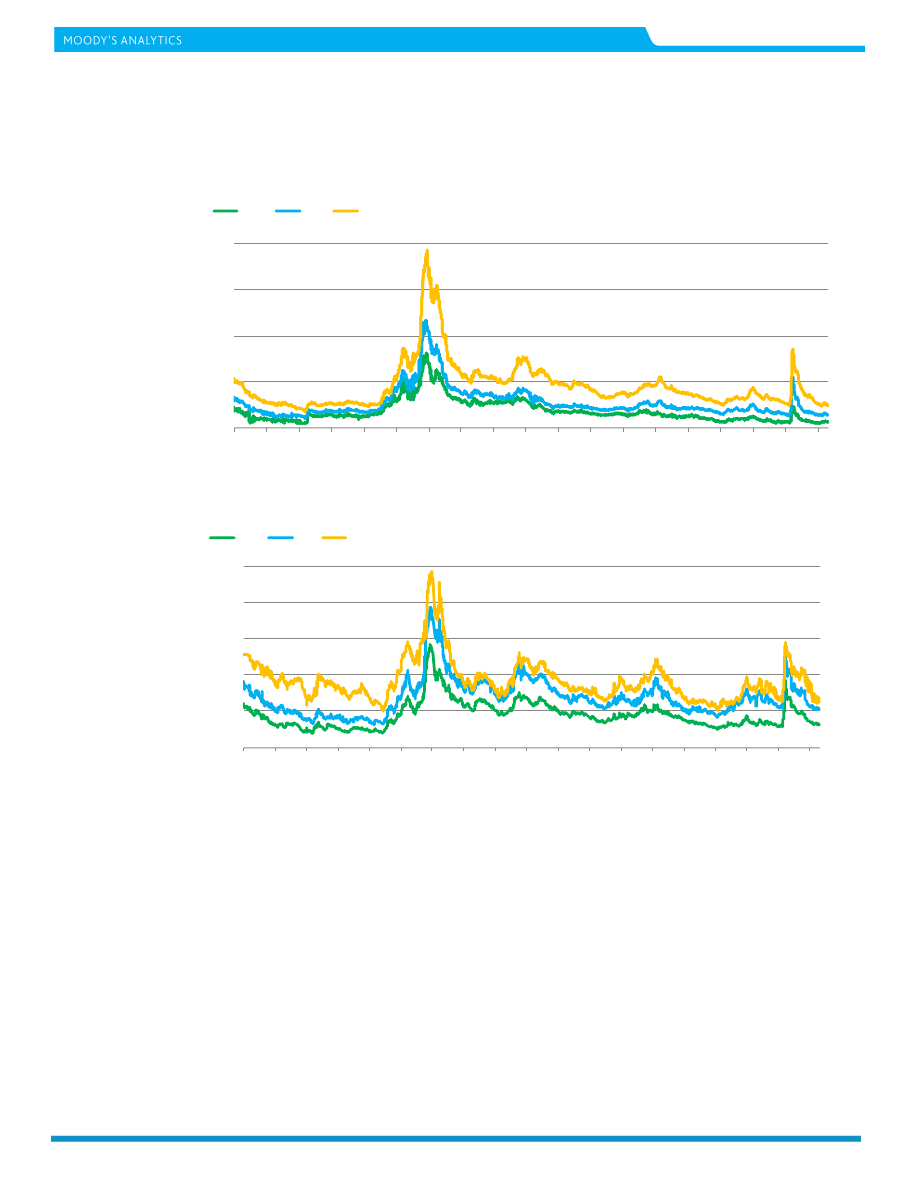
Spreads
0
200
400
600
800
0
200
400
600
800
2003 2004 2005 2006 2007 2008 2009 2010 2011 2012 2013 2014 2015 2016 2017 2018 2019 2020 2021
Spread (bp)
Spread (bp)
Aa2
A2
Baa2
Source: Moody's
Figure 1: 5-Year Median Spreads-Global Data (High Grade)
0
400
800
1,200
1,600
2,000
0
400
800
1,200
1,600
2,000
2003 2004 2005 2006 2007 2008 2009 2010 2011 2012 2013 2014 2015 2016 2017 2018 2019 2020 2021
Spread (bp)
Spread (bp)
Ba2
B2
Caa-C
Source: Moody's
Figure 2: 5-Year Median Spreads-Global Data (High Yield)

17
APRIL 29, 2021
CAPITAL MARKETS RESEARCH / MARKET OUTLOOK / MOODYS.COM
CAPI TAL MARKETS RESEARCH
Market Data
CDS Movers
CDS Implied Rating Rises
Issuer
Apr. 28
Apr. 21
Senior Ratings
Archer-Daniels-Midland Company
A2
Baa1
A2
Comcast Corporation
A2
A3
A3
American Express Credit Corporation
A2
A3
A2
Occidental Petroleum Corporation
B1
B2
Ba2
Capital One Financial Corporation
Baa2
Baa3
Baa1
United Parcel Service, Inc.
Aa3
A1
A2
Tenet Healthcare Corporation
B1
B2
Caa1
Crown Castle International Corp .
Baa2
Baa3
Baa3
ViacomCBS Inc.
Baa2
Baa3
Baa2
Dish DBS Corporation
B3
Caa1
B2
CDS Implied Rating Declines
Issuer
Apr. 28
Apr. 21
Senior Ratings
Kroger Co. (The)
Baa1
A2
Baa1
Conagra Brands, Inc.
Baa2
A3
Baa3
McDonald's Corporation
A1
Aa3
Baa1
Exxon Mobil Corporation
A2
A1
Aa2
Procter & Gamble Company (The)
Aa3
Aa2
Aa3
Johnson & Johnson
Aa2
Aa1
Aaa
Amazon.com, Inc.
A3
A2
A2
Amgen Inc.
A2
A1
Baa1
Burlington Northern Santa Fe, LLC
A1
Aa3
A3
CCO Holdings, LLC
Ba2
Ba1
B1
CDS Spread Increases
Issuer
Senior Ratings
Apr. 28
Apr. 21
Spread Diff
Staples, Inc.
B3
711
692
18
R.R. Donnelley & Sons Company
B3
476
463
13
Beazer Homes USA, Inc.
B3
314
305
9
Mattel, Inc.
Ba2
223
215
8
Colgate-Palmolive Company
Aa3
34
27
7
Amkor Technology, Inc.
B1
135
128
7
Kroger Co. (The)
Baa1
49
43
6
Conagra Brands, Inc.
Baa3
54
48
6
Yum! Brands Inc.
Ba3
92
87
6
International Game Technology
B3
282
276
6
CDS Spread Decreases
Issuer
Senior Ratings
Apr. 28
Apr. 21
Spread Diff
Tenet Healthcare Corporation
Caa1
258
313
-55
Apache Corporation
Ba1
260
310
-51
Nabors Industries, Inc .
Caa2
998
1,045
-47
Occidental Petroleum Corporation
Ba2
274
305
-31
Realogy Group LLC
Caa1
369
395
-26
Dish DBS Corporation
B2
343
367
-24
Pitney Bowes Inc.
B1
409
431
-23
United States Steel Corporation
Caa1
390
408
-19
Juniper Networks, Inc.
Baa2
93
112
-19
United Airlines Holdings, Inc.
Ba3
400
419
-18
Source: Moody's, CMA
CDS Spreads
CDS Implied Ratings
CDS Implied Ratings
CDS Spreads
Figure 3. CDS Movers - US ( April 21, 2021 – April 28, 2021)
18
APRIL 29, 2021
CAPITAL MARKETS RESEARCH / MARKET OUTLOOK / MOODYS.COM
CAPI TAL MARKETS RESEARCH
Market Data
CDS Implied Rating Rises
Issuer
Apr. 28
Apr. 21
Senior Ratings
Bayerische Landesbank
A1
Baa2
Aa3
Schaeffler Finance B.V.
A2
Baa1
Ba2
BNP Paribas
A1
A2
Aa3
National Grid plc
A1
A2
Baa2
Severn Trent Plc
Baa2
Baa3
Baa2
Thales
A3
Baa1
A2
Vedanta Resources Limited
Ca
C
Caa1
CMA CGM S.A.
Caa1
Caa2
B3
Legrand France S.A.
A2
A3
A3
Italy, Government of
Baa3
Baa3
Baa3
CDS Implied Rating Declines
Issuer
Apr. 28
Apr. 21
Senior Ratings
Rabobank
Aa3
Aa2
Aa3
Barclays PLC
Baa2
Baa1
Baa2
Portugal, Government of
A1
Aa3
Baa3
UniCredit S.p.A.
Baa3
Baa2
Baa1
Svenska Handelsbanken AB
Aa3
Aa2
Aa2
Swedbank AB
A1
Aa3
Aa3
RCI Banque
Ba3
Ba2
Baa2
ENGIE SA
A2
A1
Baa1
Compagnie de Saint-Gobain SA
A3
A2
Baa2
SSE plc
A3
A2
Baa1
CDS Spread Increases
Issuer
Senior Ratings
Apr. 28
Apr. 21
Spread Diff
Boparan Finance plc
Caa1
703
687
16
Jaguar Land Rover Automotive Plc
B1
351
347
5
RCI Banque
Baa2
190
185
4
Renault S.A.
Ba2
185
181
4
Ineos Group Holdings S.A.
B2
245
241
4
Italy, Government of
Baa3
80
77
3
Intesa Sanpaolo S.p.A.
Baa1
64
60
3
UniCredit S.p.A.
Baa1
68
65
3
Unione di Banche Italiane S.p.A.
Baa3
75
72
3
thyssenkrupp AG
B1
246
243
3
CDS Spread Decreases
Issuer
Senior Ratings
Apr. 28
Apr. 21
Spread Diff
Vedanta Resources Limited
Caa1
807
907
-100
Bayerische Landesbank
Aa3
31
66
-35
National Bank of Greece S.A.
Caa1
189
213
-24
TUI AG
Caa1
872
893
-21
CMA CGM S.A.
B3
383
403
-20
Severn Trent Plc
Baa2
54
72
-18
Novafives S.A.S.
Caa2
752
769
-17
Casino Guichard-Perrachon SA
Caa1
512
524
-12
Schaeffler Finance B.V.
Ba2
41
53
-11
Premier Foods Finance plc
B3
208
218
-10
Source: Moody's, CMA
CDS Spreads
CDS Implied Ratings
CDS Implied Ratings
CDS Spreads
Figure 4. CDS Movers - Europe ( April 21, 2021 – April 28, 2021)
19
APRIL 29, 2021
CAPITAL MARKETS RESEARCH / MARKET OUTLOOK / MOODYS.COM
CAPI TAL MARKETS RESEARCH
Market Data
Issuance
0
700
1,400
2,100
2,800
0
700
1,400
2,100
2,800
Jan Feb Mar
Apr
May
Jun
Jul
Aug
Sep
Oct
Nov
Dec
Issuance ($B)
Issuance ($B)
2018
2019
2020
2021
Source:
Moody's / Dealogic
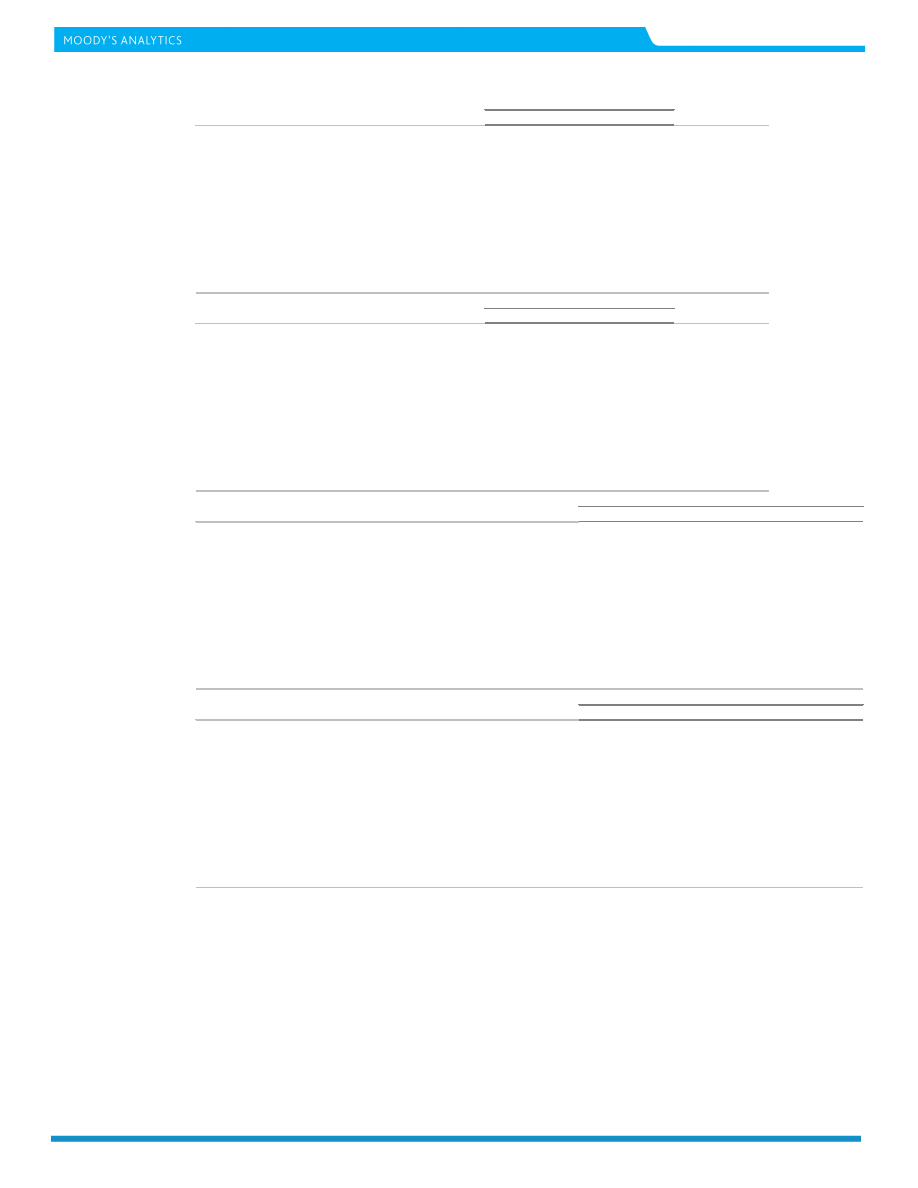
Figure 5. Market Cumulative Issuance - Corporate & Financial Institutions: USD Denominated
0
200
400
600
800
1,000
0
200
400
600
800
1,000
Jan Feb Mar
Apr
May
Jun
Jul
Aug
Sep
Oct
Nov
Dec
Issuance ($B)
Issuance ($B)
2018
2019
2020
2021
Source:
Moody's / Dealogic
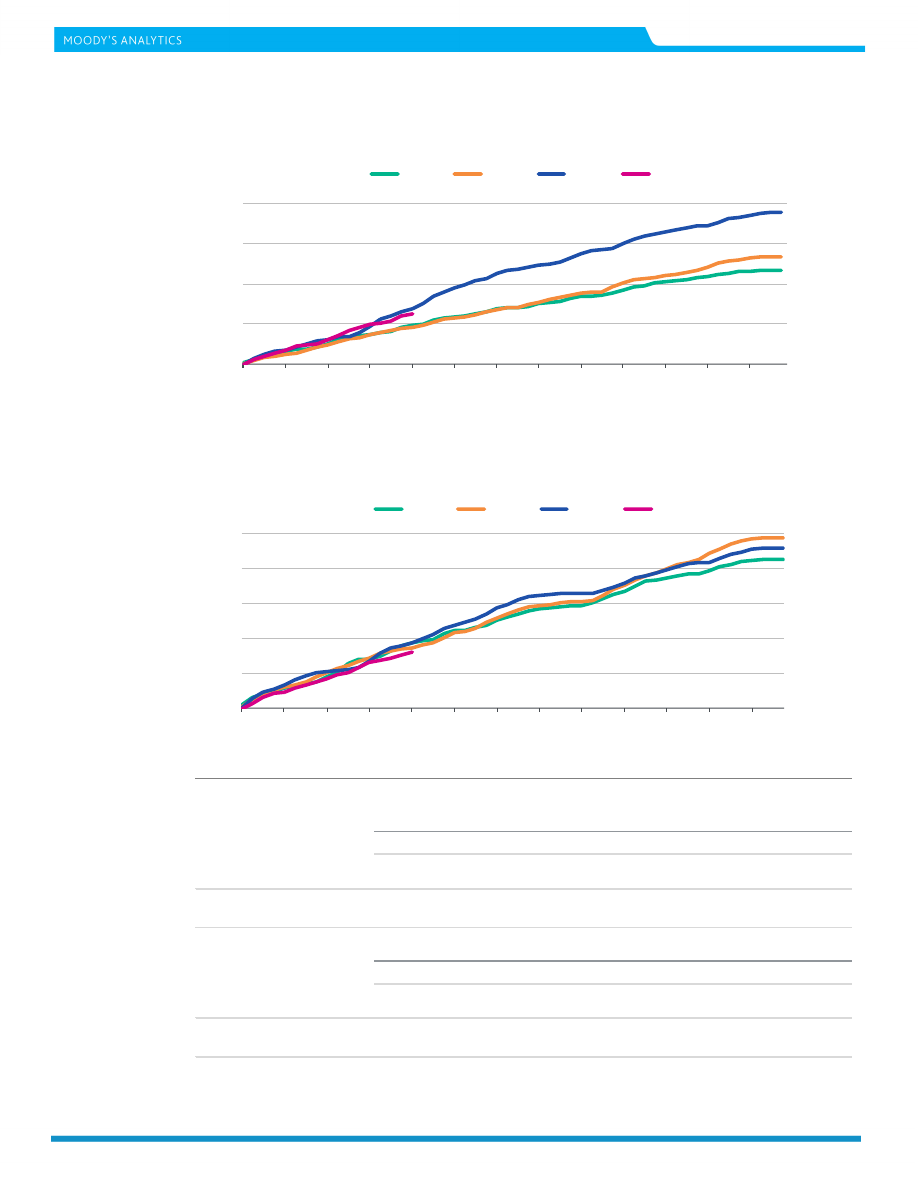
Figure 6. Market Cumulative Issuance - Corporate & Financial Institutions: Euro Denominated
Investment-Grade
High-Yield
Total*
Amount
Amount
Amount
$B
$B
$B
Weekly
37.775
11.282
49.175
Year-to-Date
612.427
253.227
885.546
Investment-Grade
High-Yield
Total*
Amount
Amount
Amount
$B
$B
$B
Weekly
14.707
3.454
18.160
Year-to-Date
254.201
56.182
320.251
* Difference represents issuance with pending ratings.
Source: Moody's/ Dealogic
USD Denominated
Euro Denominated
Figure 7. Issuance: Corporate & Financial Institutions

20
APRIL 29, 2021
CAPITAL MARKETS RESEARCH / MARKET OUTLOOK / MOODYS.COM
CAPI TAL MARKETS RESEARCH
Moody’s Capital Markets Research recent publications
Record-High Systemic Leverage Limits Upside for Benchmark Interest Rates (Capital Market Research)
Will Excessive Stimulus Lead to Excessive Leverage? (Capital Market Research)
Replay of the Inflationary 1970s Is Unlikely (Capital Market Research)
Real GDP Growth’s Biggest Improvement since 1950 May Power 2021’s Profits Growth (Capital Market Research)
Positive Outlook for Corporate Earnings Favors Narrower Credit Spreads (Capital Market Research)
Moody’s Analytics EDF-Based Bond Valuation Model Version 2.0
Stocks and High-Yield Performed Well Amid Prior Upturns by Treasury Bond Yields (Capital Market Research)
Quality Bonds Retreat as Leveraged Loans Shine (Capital Market Research)
Too Much of a Good Thing? (Capital Market Research)
Fast Declining EDF Favors Thinner High-Yield Bond Spread (Capital Market Research)
Prices Rise Here, There and Everywhere (Capital Market Research)
Investment-Grade Bond Offerings to Slow from 2020’s Torrid Pace (Capital Market Research)
Not All Debt Is Equal (Capital Market Research)
Market Value of U.S. Common Stock Soars to Record-High 185% of GDP (Capital Market Research)
Stimulatory Monetary and Fiscal Policies Enhance Corporate Credit Outlook (Capital Market Research)
Financial Markets Have Largely Priced-In 2021’s Positive Outlook (Capital Market Research)
Core Profits and U.S. Equities Set New Record Highs (Capital Market Research)
Operating Leverage May Help to Narrow Yield Spreads in 2021 (Capital Market Research)
Resurgent COVID-19 Threatens Corporate Credit’s Improved Trend (Capital Market Research)
Split Congress Sparks Rallies by Equities, Corporates and Treasuries (Capital Market Research)
Credit Disputes Equities Gloom (Capital Market Research)
Corporate Cash Outruns Corporate Debt (Capital Market Research)
Profits Give Direction to Downgrades and Defaults (Capital Market Research)
Markets Sense an Upturn Despite Pockets of Profound Misery (Capital Market Research)
Record-High Bond Issuance Aids Nascent Upturn (Capital Market Research)
Corporate Bond Issuance Boom May Steady Credit Quality, On Balance (Capital Market Research)
Markets, Bankers and Analysts Differ on 2021’s Default Rate (Capital Market Research)
Corporate Credit Mostly Unfazed by Equity Volatility (Capital Market Research)
Record August for Bond Issuance May Aid Credit Quality (Capital Market Research)
Fed Policy Shift Bodes Well for Corporate Credit (Capital Markets Research)
Markets Avoid Great Recession’s Calamities (Capital Markets Research)
Liquidity Surge Hints of More Upside Surprises (Capital Markets Research)
Unprecedented Stimulus Lessens the Blow from Real GDP’s Record Dive (Capital Markets Research)
Ultra-Low Bond Yields Buoy Corporate Borrowing (Capital Markets Research)

21
APRIL 29, 2021
CAPITAL MARKETS RESEARCH / MARKET OUTLOOK / MOODYS.COM
CAPI TAL MARKETS RESEARCH
To order reprints of this report (100 copies minimum), please call 212.553.1658 .
Report Number: 1281425
Contact Us
Editor
Reid Kanaley
Americas:
1.212.553 .4399
Europe:
+44 (0) 20.7772.5588
Asia:
813.5408.4131

22
APRIL 29, 2021
CAPITAL MARKETS RESEARCH / MARKET OUTLOOK / MOODYS.COM
CAPI TAL MARKETS RESEARCH
© 2021 Moody’s Corporation, Moody’s Investors Service, Inc., Moody’s Analytics, Inc. and/or their licensors and affiliates (collectively, “MOODY’S”). All rights reserved.
CREDIT RATINGS ISSUED BY MOODY'S CREDIT RATINGS AFFILIATES ARE THEIR CURRENT OPINIONS OF THE RELATIVE FUTURE CREDIT RISK OF ENTITIES, CREDIT
COMMITMENTS, OR DEBT OR DEBT-LIKE SECURITIES, AND MATERIALS, PRODUCTS, SERVICES AND INFORMATION PUBLISHED BY MOODY’S (COLLECTIVELY,
“PUBLICATIONS”) MAY INCLUDE SUCH CURRENT OPINIONS. MOODY’S DEFINES CREDIT RISK AS THE RISK THAT AN ENTITY MAY NOT MEET ITS CONTRACTUAL
FINANCIAL OBLIGATIONS AS THEY COME DUE AND ANY ESTIMATED FINANCIAL LOSS IN THE EVENT OF DEFAULT OR IMPAIRMENT. SEE APPLICABLE MOODY’S
RATING SYMBOLS AND DEFINITIONS PUBLICATION FOR INFORMATION ON THE TYPES OF CONTRACTUAL FINANCIAL OBLIGATIONS ADDRESSED BY MOODY’S
CREDIT RATINGS. CREDIT RATINGS DO NOT ADDRESS ANY OTHER RISK, INCLUDING BUT NOT LIMITED TO: LIQUIDITY RISK, MARKET VALUE RISK, OR PRICE
VOLATILITY. CREDIT RATINGS, NON-CREDIT ASSESSMENTS (“ASSESSMENTS”), AND OTHER OPINIONS INCLUDED IN MOODY’S PUBLICATIONS ARE NOT
STATEMENTS OF CURRENT OR HISTORICAL FACT. MOODY’S PUBLICATIONS MAY ALSO INCLUDE QUANTITATIVE MODEL-BASED ESTIMATES OF CREDIT RISK AND
RELATED OPINIONS OR COMMENTARY PUBLISHED BY MOODY’S ANALYTICS, INC. AND/OR ITS AFFILIATES. MOODY’S CREDIT RATINGS, ASSESSMENTS, OTHER
OPINIONS AND PUBLICATIONS DO NOT CONSTITUTE OR PROVIDE INVESTMENT OR FINANCIAL ADVICE, AND MOODY’S CREDIT RATINGS, ASSESSMENTS, OTHER
OPINIONS AND PUBLICATIONS ARE NOT AND DO NOT PROVIDE RECOMMENDATIONS TO PURCHASE, SELL, OR HOLD PARTICULAR SECURITIES. MOODY’S
CREDIT RATINGS, ASSESSMENTS, OTHER OPINIONS AND PUBLICATIONS DO NOT COMMENT ON THE SUITABILITY OF AN INVESTMENT FOR ANY PARTICULAR
INVESTOR. MOODY’S ISSUES ITS CREDIT RATINGS, ASSESSMENTS AND OTHER OPINIONS AND PUBLISHES ITS PUBLICATIONS WITH THE EXPECTATION AND
UNDERSTANDING THAT EACH INVESTOR WILL, WITH DUE CARE, MAKE ITS OWN STUDY AND EVALUATION OF EACH SECURITY THAT IS UNDER CONSIDERATION
FOR PURCHASE, HOLDING, OR SALE. MOODY’S CREDIT RATINGS, ASSESSMENTS, OTHER OPINIONS, AND PUBLICATIONS ARE NOT INTENDED FOR USE BY RETAIL
INVESTORS AND IT WOULD BE RECKLESS AND INAPPROPRIATE FOR RETAIL INVESTORS TO USE MOODY’S CREDIT RATINGS OR MOODY’S PUBLICATIONS WHEN MAKING
AN INVESTMENT DECISION. IF IN DOUBT YOU SHOULD CONTACT YOUR FINANCIAL OR OTHER PROFESSIONAL ADVISER.
ALL INFORMATION CONTAINED HEREIN IS PROTECTED BY LAW, INCLUDING BUT NOT LIMITED TO, COPYRIGHT LAW, AND NONE OF SUCH INFORMATION MAY BE COPIED
OR OTHERWISE REPRODUCED, REPACKAGED, FURTHER TRANSMITTED, TRANSFERRED, DISSEMINATED, REDISTRIBUTED OR RESOLD, OR STORED FOR SUBSEQUENT USE FOR
ANY SUCH PURPOSE, IN WHOLE OR IN PART, IN ANY FORM OR MANNER OR BY ANY MEANS WHATSOEVER, BY ANY PERSON WITHOUT MOODY’S PRIOR WRITTEN
CONSENT.
MOOD’S CREDIT RATINGS, ASSESSMENTS, OR OTHER OPINIONS AND PUBLICATIONS ARE NOT INTENDED FOR USE BY ANY PERSON AS A BENCHMARK AS THAT TERM IS
DEFINED FOR REGULATORY PURPOSES AND MUST NOT BE USED IN ANY WAY THAT COULD RESULT IN THEM BEING CONSIDERED A BENCHMARK.
All information contained herein is obtained by MOODY’S from sources believed by it to be accurate and reliable. Because of the possibility of human or mechanical error as well as
other factors, however, all information contained herein is provided “AS IS” without warranty of any kind. MOODY'S adopts all necessary measures so that the information it uses
in assigning a credit rating is of sufficient quality and from sources MOODY'S considers to be reliable including, when appropriate, independent third-party sources. However,
MOODY’S is not an auditor and cannot in every instance independently verify or validate information received in the rating process or in preparing the Moody’s publications.
To the extent permitted by law, MOODY’S and its directors, officers, employees, agents, representatives, licensors and suppliers disclaim liability to any person or entity for any
indirect, special, consequential, or incidental losses or damages whatsoever arising from or in connection with the information contained herein or the use of or inability to use any
such information, even if MOODY’S or any of its directors, officers, employees, agents, representatives, licensors or suppliers is advised in advance of the possibility of such losses
or damages, including but not limited to: (a) any loss of present or prospective profits or (b) any loss or damage arising where the relevant financial instrument is not the subject of
a particular credit rating assigned by MOODY’S.
To the extent permitted by law, MOODY’S and its directors, officers, employees, agents, representatives, licensors and suppliers disclaim liability for any direct or compensatory
losses or damages caused to any person or entity, including but not limited to by any negligence (but excluding fraud, willful misconduct or any other type of liability that, for the
avoidance of doubt, by law cannot be excluded) on the part of, or any contingency within or beyond the control of, MOODY’S or any of its directors, officers, employees, agents,
representatives, licensors or suppliers, arising from or in connection with the information contained herein or the use of or inability to use any such information.
NO WARRANTY, EXPRESS OR IMPLIED, AS TO THE ACCURACY, TIMELINESS, COMPLETENESS, MERCHANTABILITY OR FITNESS FOR ANY PARTICULAR PURPOSE OF ANY
CREDIT RATING OR OTHER OPINION OR INFORMATION IS GIVEN OR MADE BY MOODY’S IN ANY FORM OR MANNER WHATSOEVER.
Moody’s Investors Service, Inc., a wholly-owned credit rating agency subsidiary of Moody’s Corporation (“MCO”), hereby discloses that most issuers of debt securities (including
corporate and municipal bonds, debentures, notes and commercial paper) and preferred stock rated by Moody’s Investors Service, Inc. have, prior to assignment of any rating,
agreed to pay to Moody’s Investors Service, Inc. for ratings opinions and services rendered by it fees ranging from $1,000 to approximately $5,000,000 . MCO and MIS also
maintain policies and procedures to address the independence of MIS’s ratings and rating processes. Information regarding certain affiliations that may exist between directors of
MCO and rated entities, and between entities who hold ratings from MIS and have also publicly reported to the SEC an ownership interest in MCO of more than 5%, is posted
annually at
under the heading “Investor Relations — Corporate Governance — Director and Shareholder Affiliation Policy.”
Additional terms for Australia only: Any publication into Australia of this document is pursuant to the Australian Financial Services License of MOODY’S affiliate, Moody’s Investors
Service Pty Limited ABN 61 003 399 657AFSL 336969 and/or Moody’s Analytics Australia Pty Ltd ABN 94 105 136 972 AFSL 383569 (as applicable). This document is intended to
be provided only to “wholesale clients” within the meaning of section 761G of the Corporations Act 2001. By continuing to access this document from within Australia, you
represent to MOODY’S that you are, or are accessing the document as a representative of, a “wholesale client” and that neither you nor the entity you represent will directly or
indirectly disseminate this document or its contents to “retail clients” within the meaning of section 761G of the Corporations Act 2001. MOODY’S credit rating is an opinion as to
the creditworthiness of a debt obligation of the issuer, not on the equity securities of the issuer or any form of security that is available to retail investors.
Additional terms for Japan only: Moody's Japan K.K. (“MJKK”) is a wholly owned credit rating agency subsidiary of Moody's Group Japan G.K., which is wholly owned by Moody’s
Overseas Holdings Inc., a wholly owned subsidiary of MCO. Moody’s SF Japan K.K. (“MSFJ”) is a wholly owned credit rating agency subsidiary of MJKK. MSFJ is not a Nationally
Recognized Statistical Rating Organization (“NRSRO”). Therefore, credit ratings assigned by MSFJ are Non-NRSRO Credit Ratings. Non-NRSRO Credit Ratings are assigned by an
entity that is not a NRSRO and, consequently, the rated obligation will not qualify for certain types of treatment under U.S. laws. MJKK and MSFJ are credit rating agencies
registered with the Japan Financial Services Agency and their registration numbers are FSA Commissioner (Ratings) No. 2 and 3 respectively.
MJKK or MSFJ (as applicable) hereby disclose that most issuers of debt securities (including corporate and municipal bonds, debentures, notes and commercial paper) and preferred
stock rated by MJKK or MSFJ (as applicable) have, prior to assignment of any rating, agreed to pay to MJKK or MSFJ (as applicable) for ratings opinions and services rendered by its
fees ranging from JPY125,000 to approximately JPY550,000,000 .
MJKK and MSFJ also maintain policies and procedures to address Japanese regulatory requirements.
For Publications Issued by Moody’s Capital Markets Research, Inc. only:
The statements contained in this research report are based solely upon the opinions of Moody’s Capital Markets Research, Inc. and the data and information available to the
authors at the time of publication of this report. There is no assurance that any predicted results will actually occur. Past performance is no guarantee of future results.
The analysis in this report has not been made available to any issuer prior to publication.
When making an investment decision, investors should use additional sources of information and consult with their investment advisor. Investing in securities involves certain risks
including possible fluctuations in investment return and loss of principal. Investing in bonds presents additional risks, including changes in interest rates and credit risk.
Moody's Capital Markets Research, Inc., is a subsidiary of MCO. Please note that Moody’s Analytics, Inc., an affiliate of Moody’s Capital Markets Research, Inc. and a subsidiary of
MCO, provides a wide range of research and analytical products and services to corporations and participants in the financial markets. Customers of Moody’s Analytics, Inc. may
include companies mentioned in this report. Please be advised that a conflict may exist and that any investment decisions you make are your own responsibility. The Moody’s
Analytics logo is used on certain Moody’s Capital Markets Research, Inc. products for marketing purposes only. Moody’s Analytics, Inc. is a separate company from Moody’s Capital
Markets Research, Inc.
