GBP/USD – Still Going after the Channel Break
DailyFX.com -
Daily
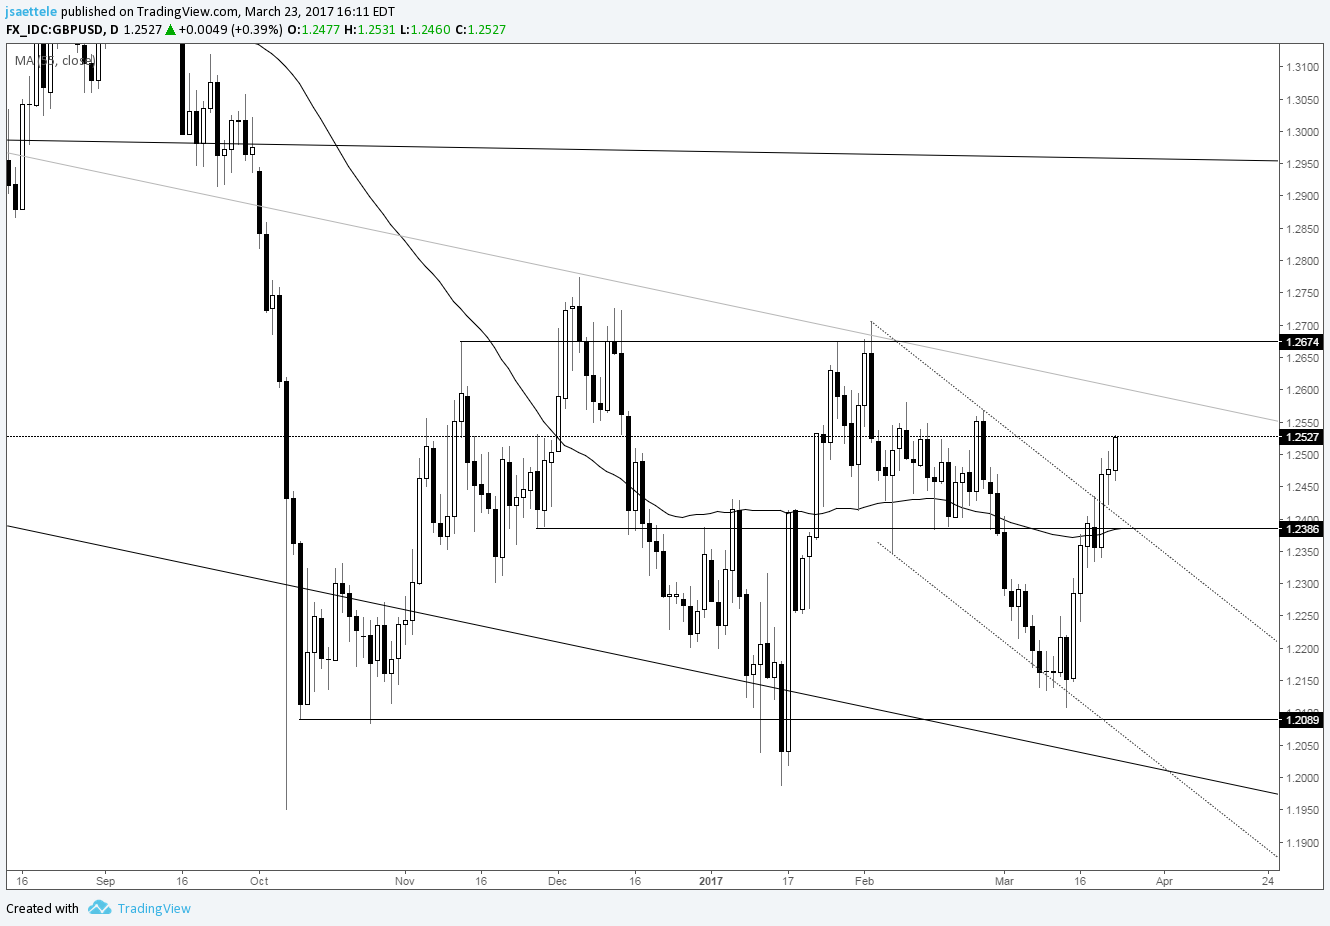
Chart Prepared by Jamie Saettele, CMT
DailyFX Trading Guides and Forecasts
-“GBP/USD rode the channel for 6 days before finally turning up. The 55 day average (now) and 1.2390 (good pivot since November) may prove tough in the near term. Even then, channel resistance is slightly higher.” The 55 day and noted 1.2390 was tough for 2 days but Cable has broken through. The short term channel has been broken as well. When viewed in the context of the possible bottoming pattern since October, upside should be taken seriously.
DailyFX provides forex news and technical analysis on the trends that influence the global currency markets.
Learn forex trading with a free practice account and trading charts from IG.
