GBP/USD Technical Analysis 05.13.2013
GBP/USD Technical Analysis – Prices declined as expected after putting in a Shooting Star candlestick below resistance at the top of a rising channel set from mid-March. Near-term support is at 1.5357, the channel bottom. A break below that targets the 1.5195-1.5249 area marked by the April 23 low and the 23.6% Fibonacci expansion. Channel resistance is now at 1.5662. We continue to hold short.
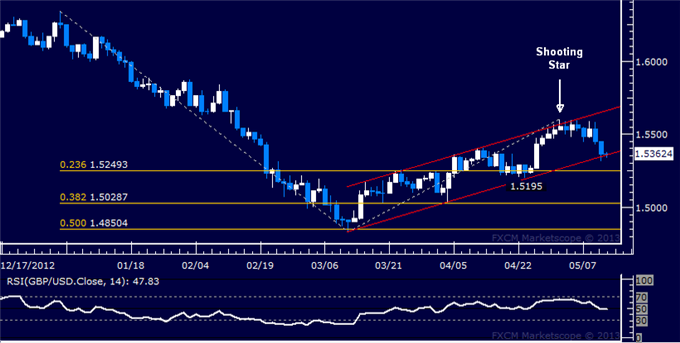
Daily Chart - Created Using FXCM Marketscope 2.0
--- Written by Ilya Spivak, Currency Strategist for Dailyfx.com
To contact Ilya, e-mail ispivak@dailyfx.com. Follow Ilya on Twitter at @IlyaSpivak
To be added to Ilya's e-mail distribution list, please CLICK HERE
New to FX? Watch this Video. For live market updates, visit the Real Time News Feed
DailyFX provides forex news and technical analysis on the trends that influence the global currency markets.
Learn forex trading with a free practice account and trading charts from FXCM.
