GBP/USD Technical Analysis – Resistance Found Near 1.69
To receive Ilya's analysis directly via email, please SIGN UP HERE
Talking Points:
GBP/USD Technical Strategy: Flat
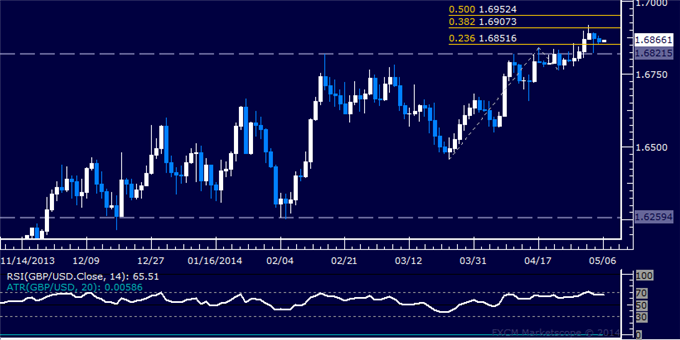
Support:1.6852 (23.6% Fib exp.), 1.6822 (Feb 17 high)
Resistance: 1.6907 (38.2% Fib exp.), 1.6952 (50% Fib exp.)
The British Pound is treading water against the US Dollar having found technical resistance near the 1.69 figure. A daily close above the 38.2% Fibonacci expansion at 1.6907 exposes the 50% level at 1.6952. Alternatively, a reversal below the 23.6% Fib at 1.6852 opens the door for a retest of the February 17 high at 1.6822, this time as support.
Our short position from 1.6789 was stopped out on a daily close above 1.6822 last week. As it stands, current positioning does not offer an attractive trade setup and we will remain on the sidelines, waiting for an attractive opportunity to present itself.
Confirm your chart-based trade setups with the Technical Analyzer. New to FX? Start Here!
Daily Chart - Created Using FXCM Marketscope 2.0
--- Written by Ilya Spivak, Currency Strategist for DailyFX.com
DailyFX provides forex news and technical analysis on the trends that influence the global currency markets.
Learn forex trading with a free practice account and trading charts from FXCM.
