GBP/USD Technical Analysis: Support Seen Sub-1.54
GBP/USD Technical Analysis – Prices pulled back as expected after putting in a Hanging Man candlestick below support-turned-resistance at the underside of a rising channel set from mid-March. The pair is now testing support at 1.5380, the 50% Fibonacci retracement, with a break below that exposing the 61.8% level at 1.5291. Near-term resistance is at 1.5467, the 38.2% Fib.
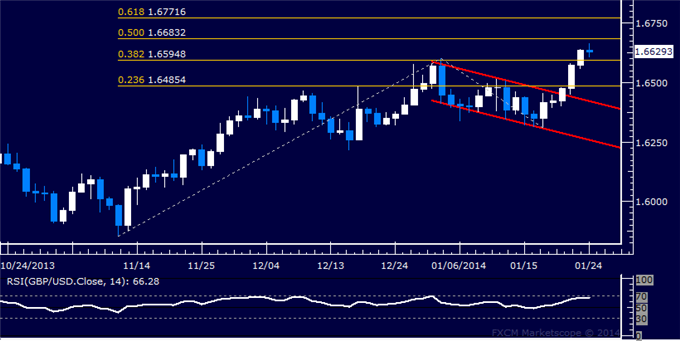
Daily Chart - Created Using FXCM Marketscope 2.0
--- Written by Ilya Spivak, Currency Strategist for Dailyfx.com
To contact Ilya, e-mail ispivak@dailyfx.com. Follow Ilya on Twitter at @IlyaSpivak
To be added to Ilya's e-mail distribution list, please CLICK HERE
New to FX? Watch this Video. For live market updates, visit the Real Time News Feed
DailyFX provides forex news and technical analysis on the trends that influence the global currency markets.
Learn forex trading with a free practice account and trading charts from FXCM.
