GBP/USD Underside of Broken Trendline is Now Estimated Resistance
Daily
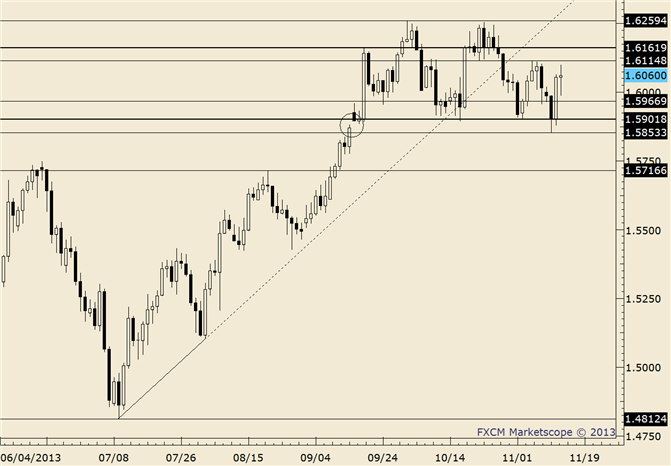
Chart Prepared by Jamie Saettele, CMT using Marketscope 2.0
Automate trades with Mirror Trader
-GBPUSD broke the trendline that originates at the July low on Tuesday. The line connects the 7/9 and 8/2 lows and crosses through several days in mid-October. This development is an early sign that the entire advance is complete.
-The underside of the mentioned trendline is now estimated resistance along with 1.6115/45 (former support).
-Weakness below 1.5893 would confirm a double top. The measured objective would be 1.5527 (width of range subtracted from 1.5893).
Trading Strategy: “GBPUSD has yet to confirm the EURUSD high. This market may very well remain within a range. With a high in place on 10/1, I am bearish for a return to the near term range lows (1.5950s) and maybe more.”
LEVELS: 1.5893 1.5960 1.6015 | 1.6077 1.6115 1.6162
DailyFX provides forex news and technical analysis on the trends that influence the global currency markets.
Learn forex trading with a free practice account and trading charts from FXCM.
