Can Gilead Sciences Inc’s (GILD) ROE Continue To Surpass The Industry Average?

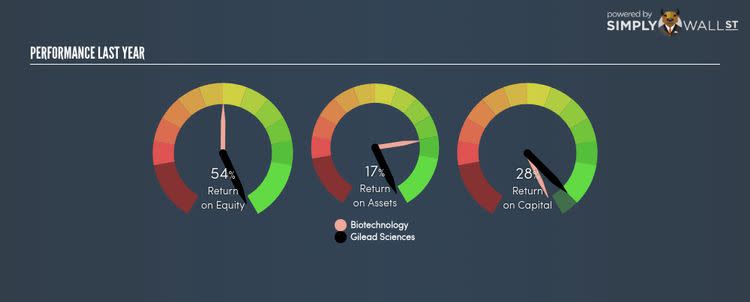
With an ROE of 54.34%, Gilead Sciences Inc (NASDAQ:GILD) outpaced its own industry which delivered a less exciting 16.08% over the past year. While the impressive ratio tells us that GILD has made significant profits from little equity capital, ROE doesn’t tell us if GILD has borrowed debt to make this happen. Today, we’ll take a closer look at some factors like financial leverage to see how sustainable GILD’s ROE is. See our latest analysis for GILD
Breaking down ROE — the mother of all ratios
Firstly, Return on Equity, or ROE, is simply the percentage of last years’ earning against the book value of shareholders’ equity. For example, if GILD invests $1 in the form of equity, it will generate $0.54 in earnings from this. Generally speaking, a higher ROE is preferred; however, there are other factors we must also consider before making any conclusions.
Return on Equity = Net Profit ÷ Shareholders Equity
ROE is assessed against cost of equity, which is measured using the Capital Asset Pricing Model (CAPM) – but let’s not dive into the details of that today. For now, let’s just look at the cost of equity number for GILD, which is 14.74%. Given a positive discrepancy of 39.61% between return and cost, this indicates that GILD pays less for its capital than what it generates in return, which is a sign of capital efficiency. ROE can be broken down into three different ratios: net profit margin, asset turnover, and financial leverage. This is called the Dupont Formula:
Dupont Formula
ROE = profit margin × asset turnover × financial leverage
ROE = (annual net profit ÷ sales) × (sales ÷ assets) × (assets ÷ shareholders’ equity)
ROE = annual net profit ÷ shareholders’ equity
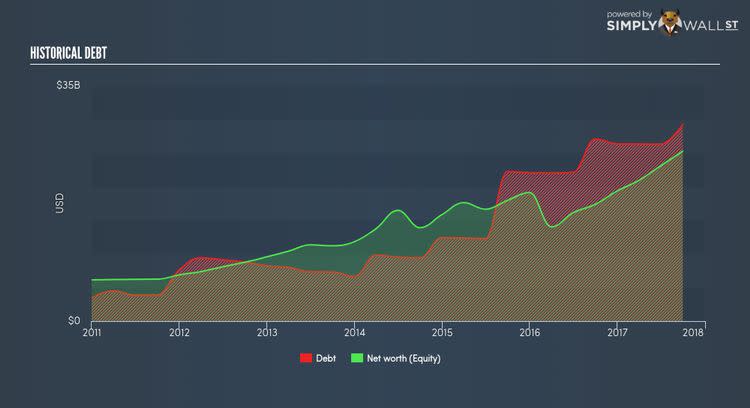
The first component is profit margin, which measures how much of sales is retained after the company pays for all its expenses. Asset turnover reveals how much revenue can be generated from GILD’s asset base. Finally, financial leverage will be our main focus today. It shows how much of assets are funded by equity and can show how sustainable GILD’s capital structure is. Since financial leverage can artificially inflate ROE, we need to look at how much debt GILD currently has. At 115.87%, GILD’s debt-to-equity ratio appears balanced and indicates the above-average ROE is generated from its capacity to increase profit without a large debt burden.
What this means for you:
Are you a shareholder? GILD exhibits a strong ROE against its peers, as well as sufficient returns to cover its cost of equity. Since ROE is not inflated by excessive debt, it might be a good time to add more of GILD to your portfolio if your personal research is confirming what the ROE is telling you. If you’re looking for new ideas for high-returning stocks, you should take a look at our free platform to see the list of stocks with Return on Equity over 20%.
Are you a potential investor? If GILD has been on your watch list for a while, making an investment decision based on ROE alone is unwise. I recommend you do additional fundamental analysis by looking through our most recent infographic report on Gilead Sciences to help you make a more informed investment decision.
To help readers see pass the short term volatility of the financial market, we aim to bring you a long-term focused research analysis purely driven by fundamental data. Note that our analysis does not factor in the latest price sensitive company announcements.
The author is an independent contributor and at the time of publication had no position in the stocks mentioned.
