All That Glitters is Not Goldminers ̶ Yet

By most indications, the U.S. economy is in good shape. For traders and investors, it’s in the “Goldilocks zone” of low rates, low inflation and high corporate profits. These conditions make it seem as though the economy is primed for more growth, which makes most equity investments especially appealing.
But some stocks suffer when times are good on Wall Street. This has been especially evident in gold mining stocks, which have traded sideways through 2018. Gold as a commodity has remained within a $60 range while precious metal traders anticipate inflationary signals that have yet to materialize.
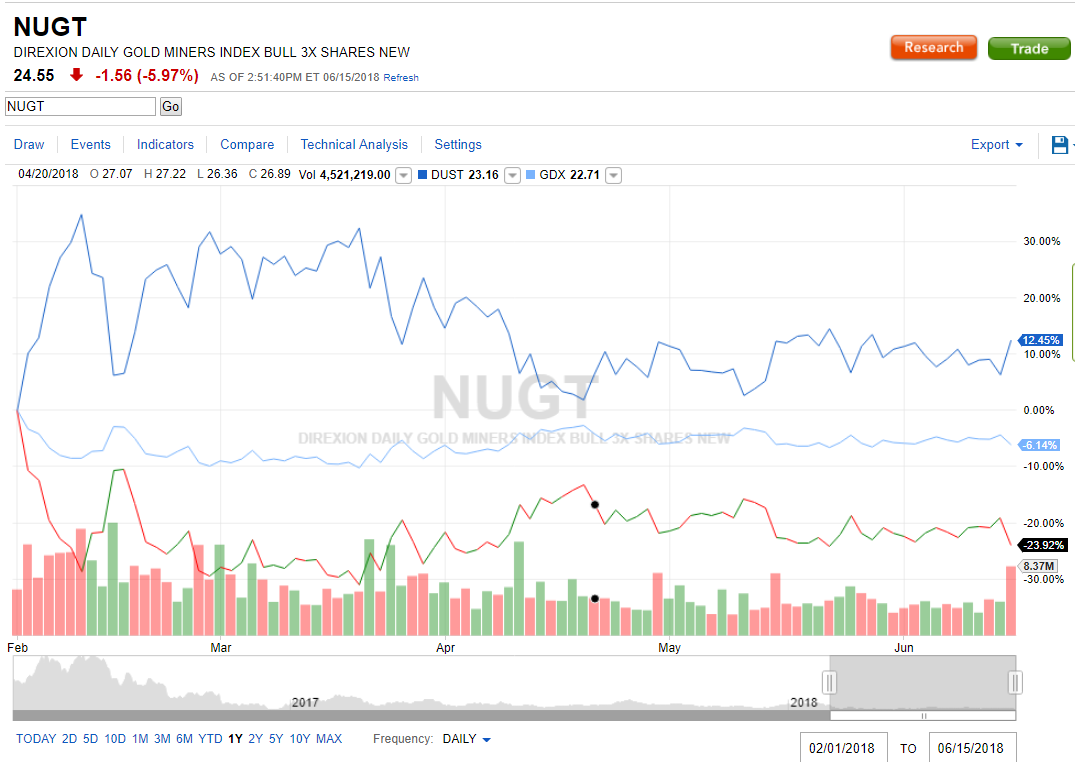
The effect on miners is clear if one takes a look at the index tracked by the Direxion Daily Gold Miners Index Bull and Bear 3X Shares ETF (NYSE: NUGT) (NYSE: DUST), which has remained range-bound since February.
There are quite a few reasons for this inactivity in the gold and miner charts: the high value of the dollar, low volatility, and no sweeping geopolitical risk to upset things, at least, none that traders care about anymore. Anything that might have signaled an upset in stocks or cued some volatility has subsided without much hand wringing from investors considering whether or not to pick up some safety investments in gold.
However, while the dollar remains strong and U.S. Federal Reserve is still on the lookout for CPI creep, the rest of the world is bracing for a tightening global market. While that alone might increase global demand for gold, another bull signal for gold seems in the cards for U.S. traders. That signal is the inversion of the bond yield curve. Bond yield has an inverse correlation with interest rates. As rates rise, demand for new bonds goes up and the yield on pre-existing bonds goes down in kind. For this reason, longer-term bonds of 30-years are more valuable than short-term 2-, 5- or 10-year notes since there is greater risk of loss due to changing interest rates.
But, since the yield on longer-term debt instruments has remained within a 1 percent range since 2015 (it’s currently around 2.75-3 percent on the 30-year), and the Federal Reserve has signaled its plan to continue raising interest rates, the shorter-term instruments are closing the gap. By June 15, the yield on the 10-year note was within 0.15 percent of the 30-year. If the 10-year surpasses the 30-year (an inverted yield curve), this is usually an indication that the economy is set to enter a recessionary period.
This is by no means set in stone, and the historical correlation does not necessarily mean a recession is inevitable in the near-term. The correlation between an inverted yield curve and an economic downturn has to do with the investment value of long-term debt for the borrower, in this case the U.S. government. If short-term debt is more appealing to investors (or lenders) than long-term debt, the government will need to redeem those notes sooner and limit the utility of the borrowed capital. In essence, an inverted curve increases demand for short-term debt, which is inherently less useful to the government.
While this might not bode well for the federal government, private businesses have managed to hum along nicely enough, which might stay an all-out recession. However, if the yield curve does invert, traders will take note, and that might just be the moment gold miners begin to shine.
See more from Benzinga
A Look Back At What's Happened To Each Sector Through The First Half Of 2018 (Part 2)
A Look Back At What's Happened To Each Sector Through The First Half Of 2018 (Part 1)
A New Automation ETF For Traders Who Haven't Yet Been Replaced By Robots
© 2018 Benzinga.com. Benzinga does not provide investment advice. All rights reserved.
