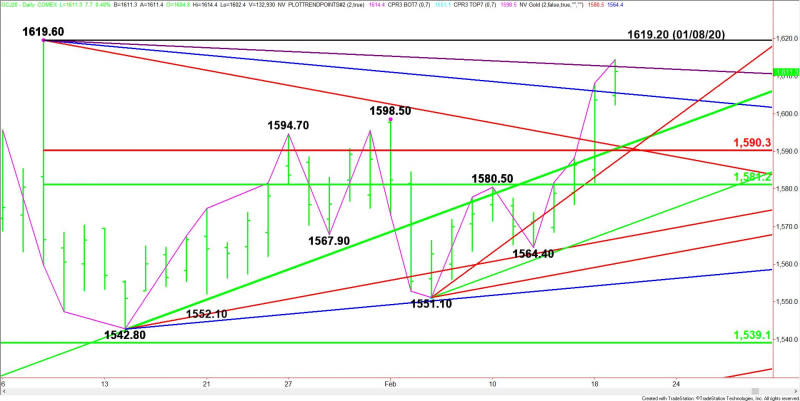
Gold (GC) Technical Analysis Price Futures – Strengthens Over $1612.60, Weakens Under $1605.60
Gold futures are trading higher on Wednesday as concerns over the global economic impact of the coronavirus epidemic raised expectations that several major central banks may have to take action to prevent a recession in their respective countries. These action could include further interest rate cuts and quantitative easing. Both moves tend to reduce the opportunity cost of holding, non-yielding bullion, making gold an attractive investment.
At 13:11 GMT, April Comex gold is trading $1611.00, up $7.40 or +0.47%.
Traders should look for volatility late in the session after the U.S. Federal Reserve releases the minutes of its January 28-29 monetary policy meeting. Although the Fed left interest rates unchanged and hinted that it would hold rates steady until inflation picks up, gold traders will be more interested in what the Fed had to say about the potential impact of the coronavirus on the economy. The news could trigger a volatile response especially if their outlook is dovish.

Daily Technical Analysis
The main trend is up according to the daily swing chart. The uptrend was reaffirmed earlier today when buyers took out yesterday’s high. A trade through $1564.40 will change the main trend to down. This is highly unlikely, but the prolonged move up in terms of price and time has put the market in a position to post a potentially bearish closing price reversal top.
This higher-high, lower-close chart pattern will likely be formed if the Fed minutes are hawkish.
The main range is $1619.60 to $1542.80. Its retracement zone at $1590.30 to $1581.20 is new support.
Daily Technical Forecast
Based on the early price action and the current price at $1611.00, the direction of the April Comex gold market the rest of the session on Wednesday is likely to be determined by trader reaction to the downtrending Gann angle at $1612.60.
Bullish Scenario
A sustained move over $1612.60 will indicate the buying is getting stronger. This could trigger a rally into the January 8, 2020 main top at $1619.20. Taking out this level could trigger an acceleration to the upside.
Bearish Scenario
A sustained move under $1612.60 will signal the presence of sellers. The first downside target is another downtrending Gann angle at $1605.60.
If sellers come in strong under $1605.60 then watch for an acceleration to the downside with the next potential downside target a support cluster at $1591.60 to $1590.30.
This article was originally posted on FX Empire
