Gold Price Futures (GC) Technical Analysis – Double-Bottom Confirmed on Breakout Over $1310.10
Gold futures settled lower on Friday while posting an inside move. The chart pattern usually indicates trader indecision or impending volatility. In this case, we could be looking at the early stages of a transition from bullish to bearish.
There was no follow-through to the upside following the expanded rally on Thursday. This typically indicates the move was fueled by short-covering. There were two key takeaways from the daily chart last week. Firstly, value-seekers showed respect for a major retracement zone at $1280.80 to $1261.70. Secondly, buyers came in to defend the main bottom at $1273.20.
On Friday, June Comex gold settled at $1289.20, down $1.80 or -0.14%.
Daily Swing Chart Technical Analysis
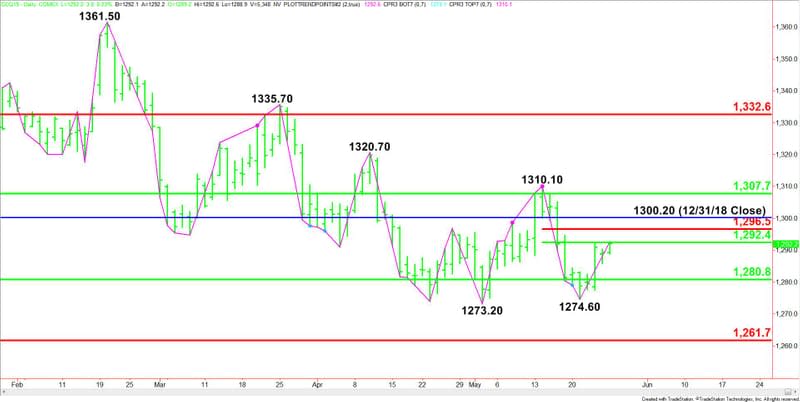
The main trend is up according to the daily swing chart, however, momentum has been trending lower since the formation of the closing price reversal top at $1310.10 on May 14.
A trade through $1310.10 will negate the closing price reversal top and signal a resumption of the uptrend. A move through $1274.60 will change the main trend to down and a move through $1273.20 will confirm the change in trend.
The major support is the retracement zone at $1280.80 to $1261.70. This zone stopped the selling at $1273.20 on May 2 and at $1274.60 on May 21.
The short-term range is $1310.10 to $1274.60. Its retracement zone at $1292.40 to $1296.50 is the first upside target. This zone is important to the structure of the chart pattern. Aggressive counter-trend sellers could come in to stop the rally in an effort to form a secondary lower top.
The long-term range that is controlling the direction of the gold market is $1307.70 to $1332.60.
Daily Swing Chart Technical Forecast
If a double-bottom is forming at $1273.20 to $1274.60 then the first sign of strength will be overcoming the short-term retracement zone at $1292.40 to $1296.50. The next target is the December 31, 2018 close at $1300.20.
Overtaking $1300.20 will put gold higher for the year. This could create the upside momentum needed to challenge the long-term 50% level at $1307.70 and the main top at $1310.10.
This article was originally posted on FX Empire
More From FXEMPIRE:
EUR/USD Daily Forecast – Fiber Leveled Up Near 1.1211 Marks as Farage Grabs a Majority
Oil Price Fundamental Daily Forecast – Short Sellers May Have Fired First Warning Shot Last Week
Stellar’s Lumen Technical Analysis – Resistance Levels in Play – 27/05/19
EUR/USD Forex Technical Analysis – Momentum Shifted to Upside with Closing Price Reversal Bottom
