Gold Price Futures (GC) Technical Analysis – Sustained Move Over $1353.00 Targets $1370.50
April Comex Gold futures finished higher on Thursday in response to a weaker U.S. Dollar. Gains may have been limited by rising U.S. Treasury yields and ahead of the U.S. Non-Farm Payrolls report at 1330 GMT.
Daily Swing Chart Analysis
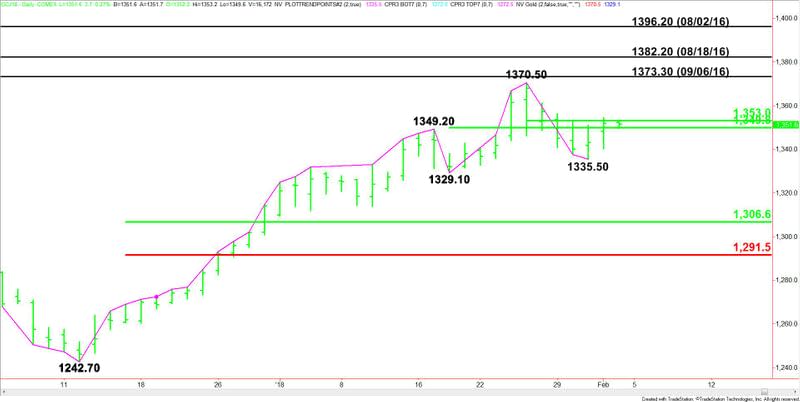
The main trend is up according to the daily swing chart. However, momentum has been drifting sideways to lower since January 25.
A trade through $1370.50 will signal a resumption of the uptrend. A move through $1329.10 will change the main trend to down. Yesterday’s price action made $1335.50 a new minor bottom.
The minor range is $1329.10 to $1370.50. Its 50% level or pivot is $1349.80.
The short-term range is $1370.50 to $1335.50. Its 50% level or pivot is $1353.00.
The minor range and short-term pivots are controlling the direction of the market.
The main range is $1242.70 to $1370.50. If the trend changes to down then look for a possible correction into its retracement zone at $1306.60 to $1291.50.
Daily Swing Chart Forecast
Based on the early price action, the direction of the gold market today is likely to be determined by trader reaction to $1349.80 and $1353.00.
A sustained move under $1349.80 will indicate the presence of sellers. This could generate the downside momentum needed to take out $1335.50. This will turn the minor trend down and could trigger a further break into $1329.10. This is a possible trigger point for an acceleration into $1306.60.
A sustained move over $1353.00 will signal the presence of buyers. If buying volume increases on this move then look for a surge to the upside with $1370.50 the next major target.
Taking out $1370.50 could create the upside momentum needed to challenge the September 6, 2016 main top at $1373.30. This is followed by the August 18, 2016 main top at $1382.20.
This article was originally posted on FX Empire
