Gold Price Futures (GC) Technical Analysis – Buyers Betting on Fed Rate Cut
Gold futures rose on Monday as investors increased bets the economy would weaken enough to cause the U.S. Federal Reserve to cut interest rates later in the year. Although the press and some analysts are calling the move “safe-haven” buying, in my opinion this doesn’t make sense.
What does makes sense is that worries about an escalation of the trade dispute between the United States and China are raising concerns about a U.S. economic slowdown and this could cause a recession. This thought is also being reflected in the Treasury markets where a portion of the yield curve inverted.
Flight-to-safety buying in gold is usually a short-term investment strategy. However, expectations of lower interest rates will make the U.S. Dollar a less-attractive investment and this should drive up demand for dollar-denominated gold.
At 19:19 GMT, June Comex gold is trading $1300.20, up $12.80 or +0.99%.
Daily Swing Chart Technical Analysis
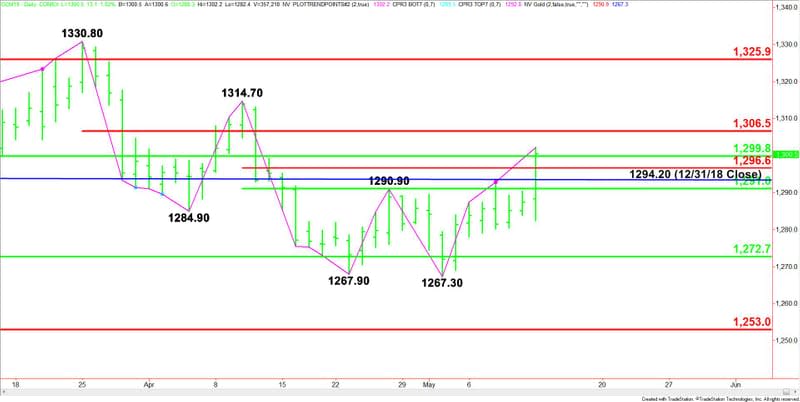
The main trend is up according to the daily swing chart. It turned up late last week when buyers took out the previous main top at $1290.90. Today’s surge accelerated to the upside when buyers crossed $1294.20, turning the market higher for the year.
The next target is the April 10 main top at $1314.70. The main trend will change to down on a trade through $1267.30. The market is now inside the 7 to 10 day window of time so start watching for a closing price reversal top.
The major long-term retracement zone is $1299.80 to $1325.90. This area could serve as resistance.
The main range is $1330.80 to $1267.30. Its retracement zone at $1299.10 to $1306.50 is currently being tested. This zone could also turn out to be resistance.
The short-term range is $1314.70 to $1267.30. The retracement zone at $1296.60 to $1291.00 is new support.
Daily Swing Chart Technical Forecast
Based on the current price at $1300.70, the direction of the June Comex gold futures contract on Tuesday is likely to bet determined by trader reaction to the 50% level at $1299.80.
Bullish Scenario
A sustained move over $1299.80 will indicate the presence of buyers. If this creates enough upside momentum then look for a potential surge into the Fibonacci level at $1306.50. This is the trigger point for an acceleration into the next main top at $1314.70.
Bearish Scenario
A sustained move under $1299.80 will signal the presence of sellers. This could trigger a labored break into the short-term Fib level at $1296.60, last year’s close at $1294.20 and the short-term 50% level at $1291.00. If this price level fails then look for an expansion of the selling into $1284.70.
This article was originally posted on FX Empire
