Gold Sinks to Monthly Bottom, Crude Oil Hits Lowest Level in Two Weeks
Talking Points:
US Dollar Breaks Resistance, Hinting at More Gains Ahead
S&P 500 Recovery Continues as Prices Approach April Top
Gold Testing Monthly Bottom, Crude Oil Sets Two-Week Low
Can’t access to the Dow Jones FXCM US Dollar Index? Try the USD basket on Mirror Trader. **
US DOLLAR TECHNICAL ANALYSIS – Prices edged above resistance at 10468, the intersection of the 38.2% Fibonacci retracement and the underside of a falling channel set from mid-February. Buyers now aim to challenge the 50% level at 10488, with a further break above that exposing the 61.8% Fib at 10508. A turn back below 10468 aims for the 23.6% retracement at 10444.

Daily Chart - Created Using FXCM Marketscope 2.0
** The Dow Jones FXCM US Dollar Index and the Mirror Trader USD basket are not the same product.
S&P 500 TECHNICAL ANALYSIS – Prices rebounded as expected after putting in a Piercing Line candlestick pattern. A break above the 38.2% Fibonacci expansion at 1870.70 has exposed the 50% level at 1889.70, with a further push beyond that eyeing the 61.8% Fib at 1908.70.Alternatively, a reversal back below 1870.70 targets the 23.6% expansion at 1847.10.
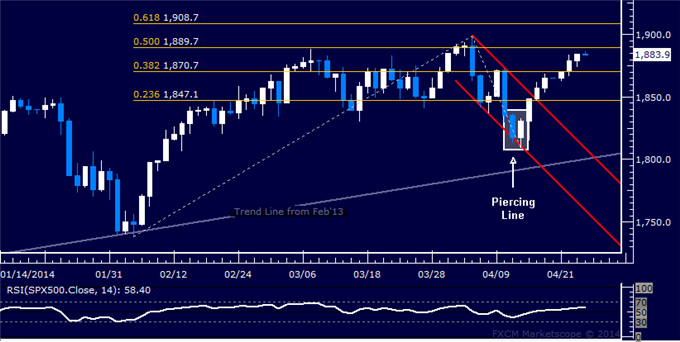
Daily Chart - Created Using FXCM Marketscope 2.0
GOLD TECHNICAL ANALYSIS – Prices continue to edge lower, taking out support at 1287.14 marked by the 38.2% Fibonacci expansion and exposing the 50% level at 1273.57. A further push beneath that aims for the 61.8% Fib at 1260.01. Alternatively, a reversal back above 1287.14 sees the first layer of resistance at 1303.93, the 23.6% expansion.
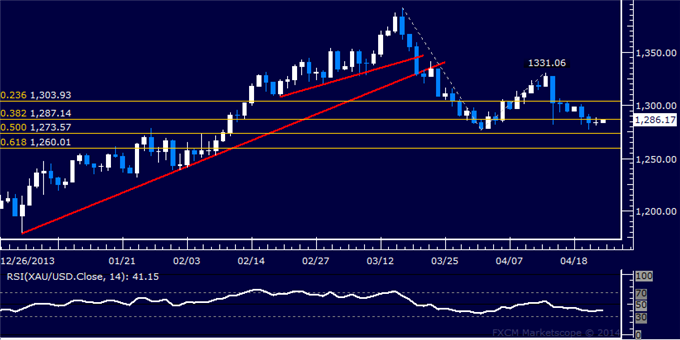
Daily Chart - Created Using FXCM Marketscope 2.0
CRUDE OIL TECHNICAL ANALYSIS – Prices are turned sharply lower below the 105.00 figure, sinking to challenge support at 101.04 marked by the 50% Fibonacci expansion. A break below this boundary initially exposes the 61.8% level at 100.11. Near-term resistance is at 101.96, the 38.2% Fib, followed by the 23.6% expansion at 103.11.
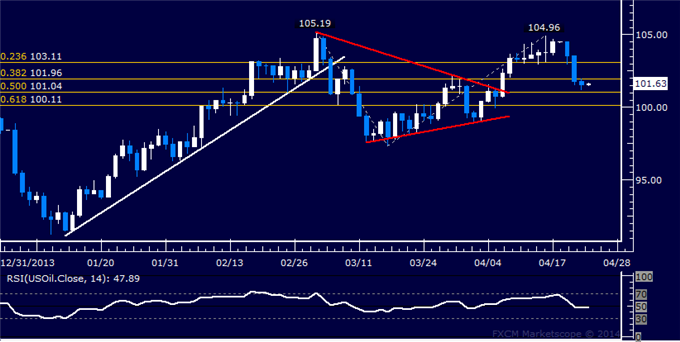
Daily Chart - Created Using FXCM Marketscope 2.0
--- Written by Ilya Spivak, Currency Strategist for DailyFX.com
To receive Ilya's analysis directly via email, please SIGN UP HERE
Contact and follow Ilya on Twitter: @IlyaSpivak
DailyFX provides forex news and technical analysis on the trends that influence the global currency markets.
Learn forex trading with a free practice account and trading charts from FXCM.
