How Good Is Kansas City Southern (NYSE:KSU) At Creating Shareholder Value?

Want to participate in a short research study? Help shape the future of investing tools and receive a $20 prize!
Today we’ll evaluate Kansas City Southern (NYSE:KSU) to determine whether it could have potential as an investment idea. Specifically, we’ll consider its Return On Capital Employed (ROCE), since that will give us an insight into how efficiently the business can generate profits from the capital it requires.
First, we’ll go over how we calculate ROCE. Then we’ll compare its ROCE to similar companies. Then we’ll determine how its current liabilities are affecting its ROCE.
Understanding Return On Capital Employed (ROCE)
ROCE is a metric for evaluating how much pre-tax income (in percentage terms) a company earns on the capital invested in its business. All else being equal, a better business will have a higher ROCE. Overall, it is a valuable metric that has its flaws. Renowned investment researcher Michael Mauboussin has suggested that a high ROCE can indicate that ‘one dollar invested in the company generates value of more than one dollar’.
How Do You Calculate Return On Capital Employed?
The formula for calculating the return on capital employed is:
Return on Capital Employed = Earnings Before Interest and Tax (EBIT) ÷ (Total Assets – Current Liabilities)
Or for Kansas City Southern:
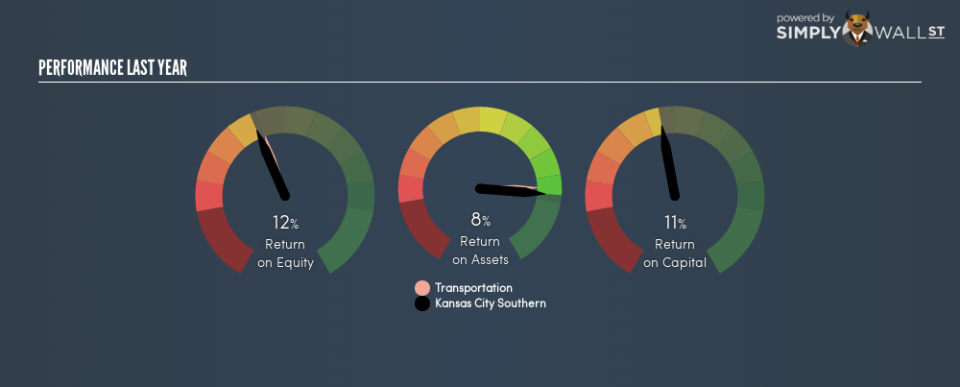
0.11 = US$968m ÷ (US$9.5b – US$447m) (Based on the trailing twelve months to December 2018.)
So, Kansas City Southern has an ROCE of 11%.
View our latest analysis for Kansas City Southern
Does Kansas City Southern Have A Good ROCE?
ROCE is commonly used for comparing the performance of similar businesses. It appears that Kansas City Southern’s ROCE is fairly close to the Transportation industry average of 12%. Separate from Kansas City Southern’s performance relative to its industry, its ROCE in absolute terms looks satisfactory, and it may be worth researching in more depth.
When considering this metric, keep in mind that it is backwards looking, and not necessarily predictive. Companies in cyclical industries can be difficult to understand using ROCE, as returns typically look high during boom times, and low during busts. This is because ROCE only looks at one year, instead of considering returns across a whole cycle. Since the future is so important for investors, you should check out our free report on analyst forecasts for Kansas City Southern.
What Are Current Liabilities, And How Do They Affect Kansas City Southern’s ROCE?
Liabilities, such as supplier bills and bank overdrafts, are referred to as current liabilities if they need to be paid within 12 months. The ROCE equation subtracts current liabilities from capital employed, so a company with a lot of current liabilities appears to have less capital employed, and a higher ROCE than otherwise. To counteract this, we check if a company has high current liabilities, relative to its total assets.
Kansas City Southern has total liabilities of US$447m and total assets of US$9.5b. As a result, its current liabilities are equal to approximately 4.7% of its total assets. With low current liabilities, Kansas City Southern’s decent ROCE looks that much more respectable.
The Bottom Line On Kansas City Southern’s ROCE
This is good to see, and while better prospects may exist, Kansas City Southern seems worth researching further. But note: Kansas City Southern may not be the best stock to buy. So take a peek at this free list of interesting companies with strong recent earnings growth (and a P/E ratio below 20).
For those who like to find winning investments this free list of growing companies with recent insider purchasing, could be just the ticket.
We aim to bring you long-term focused research analysis driven by fundamental data. Note that our analysis may not factor in the latest price-sensitive company announcements or qualitative material.
If you spot an error that warrants correction, please contact the editor at editorial-team@simplywallst.com. This article by Simply Wall St is general in nature. It does not constitute a recommendation to buy or sell any stock, and does not take account of your objectives, or your financial situation. Simply Wall St has no position in the stocks mentioned. On rare occasion, data errors may occur. Thank you for reading.
