How Good Is Smith & Nephew plc (LON:SN.), When It Comes To ROE?

Want to participate in a short research study? Help shape the future of investing tools and you could win a $250 gift card!
One of the best investments we can make is in our own knowledge and skill set. With that in mind, this article will work through how we can use Return On Equity (ROE) to better understand a business. To keep the lesson grounded in practicality, we'll use ROE to better understand Smith & Nephew plc (LON:SN.).
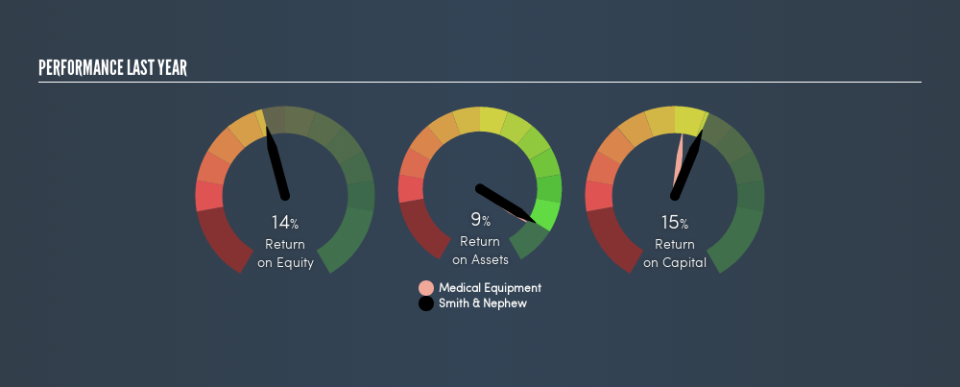
Over the last twelve months Smith & Nephew has recorded a ROE of 14%. That means that for every £1 worth of shareholders' equity, it generated £0.14 in profit.
Check out our latest analysis for Smith & Nephew
How Do I Calculate Return On Equity?
The formula for return on equity is:
Return on Equity = Net Profit ÷ Shareholders' Equity
Or for Smith & Nephew:
14% = US$663m ÷ US$4.9b (Based on the trailing twelve months to December 2018.)
It's easy to understand the 'net profit' part of that equation, but 'shareholders' equity' requires further explanation. It is all the money paid into the company from shareholders, plus any earnings retained. Shareholders' equity can be calculated by subtracting the total liabilities of the company from the total assets of the company.
What Does Return On Equity Signify?
ROE looks at the amount a company earns relative to the money it has kept within the business. The 'return' is the yearly profit. The higher the ROE, the more profit the company is making. So, as a general rule, a high ROE is a good thing. Clearly, then, one can use ROE to compare different companies.
Does Smith & Nephew Have A Good Return On Equity?
By comparing a company's ROE with its industry average, we can get a quick measure of how good it is. However, this method is only useful as a rough check, because companies do differ quite a bit within the same industry classification. You can see in the graphic below that Smith & Nephew has an ROE that is fairly close to the average for the Medical Equipment industry (13%).
That's not overly surprising. ROE doesn't tell us if the share price is low, but it can inform us to the nature of the business. For those looking for a bargain, other factors may be more important. If you like to buy stocks alongside management, then you might just love this free list of companies. (Hint: insiders have been buying them).
How Does Debt Impact Return On Equity?
Most companies need money -- from somewhere -- to grow their profits. That cash can come from retained earnings, issuing new shares (equity), or debt. In the first two cases, the ROE will capture this use of capital to grow. In the latter case, the use of debt will improve the returns, but will not change the equity. Thus the use of debt can improve ROE, albeit along with extra risk in the case of stormy weather, metaphorically speaking.
Combining Smith & Nephew's Debt And Its 14% Return On Equity
Although Smith & Nephew does use debt, its debt to equity ratio of 0.30 is still low. The combination of modest debt and a very respectable ROE suggests this is a business worth watching. Conservative use of debt to boost returns is usually a good move for shareholders, though it does leave the company more exposed to interest rate rises.
The Bottom Line On ROE
Return on equity is one way we can compare the business quality of different companies. In my book the highest quality companies have high return on equity, despite low debt. If two companies have around the same level of debt to equity, and one has a higher ROE, I'd generally prefer the one with higher ROE.
Having said that, while ROE is a useful indicator of business quality, you'll have to look at a whole range of factors to determine the right price to buy a stock. It is important to consider other factors, such as future profit growth -- and how much investment is required going forward. So you might want to take a peek at this data-rich interactive graph of forecasts for the company.
Of course, you might find a fantastic investment by looking elsewhere. So take a peek at this free list of interesting companies.
We aim to bring you long-term focused research analysis driven by fundamental data. Note that our analysis may not factor in the latest price-sensitive company announcements or qualitative material.
If you spot an error that warrants correction, please contact the editor at editorial-team@simplywallst.com. This article by Simply Wall St is general in nature. It does not constitute a recommendation to buy or sell any stock, and does not take account of your objectives, or your financial situation. Simply Wall St has no position in the stocks mentioned. Thank you for reading.
