How Good Is Western Areas Limited (ASX:WSA) At Creating Shareholder Value?

Today we'll evaluate Western Areas Limited (ASX:WSA) to determine whether it could have potential as an investment idea. To be precise, we'll consider its Return On Capital Employed (ROCE), as that will inform our view of the quality of the business.
First up, we'll look at what ROCE is and how we calculate it. Next, we'll compare it to others in its industry. And finally, we'll look at how its current liabilities are impacting its ROCE.
Return On Capital Employed (ROCE): What is it?
ROCE is a measure of a company's yearly pre-tax profit (its return), relative to the capital employed in the business. All else being equal, a better business will have a higher ROCE. Ultimately, it is a useful but imperfect metric. Author Edwin Whiting says to be careful when comparing the ROCE of different businesses, since 'No two businesses are exactly alike.
How Do You Calculate Return On Capital Employed?
Analysts use this formula to calculate return on capital employed:
Return on Capital Employed = Earnings Before Interest and Tax (EBIT) ÷ (Total Assets - Current Liabilities)
Or for Western Areas:
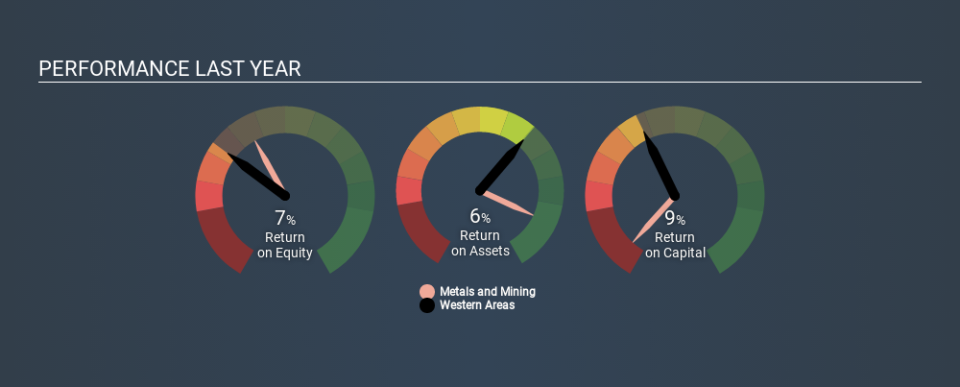
0.089 = AU$51m ÷ (AU$642m - AU$65m) (Based on the trailing twelve months to December 2019.)
So, Western Areas has an ROCE of 8.9%.
See our latest analysis for Western Areas
Does Western Areas Have A Good ROCE?
When making comparisons between similar businesses, investors may find ROCE useful. It appears that Western Areas's ROCE is fairly close to the Metals and Mining industry average of 9.7%. Aside from the industry comparison, Western Areas's ROCE is mediocre in absolute terms, considering the risk of investing in stocks versus the safety of a bank account. Investors may wish to consider higher-performing investments.
Western Areas reported an ROCE of 8.9% -- better than 3 years ago, when the company didn't make a profit. This makes us wonder if the company is improving. You can click on the image below to see (in greater detail) how Western Areas's past growth compares to other companies.
Remember that this metric is backwards looking - it shows what has happened in the past, and does not accurately predict the future. ROCE can be deceptive for cyclical businesses, as returns can look incredible in boom times, and terribly low in downturns. ROCE is, after all, simply a snap shot of a single year. Remember that most companies like Western Areas are cyclical businesses. Since the future is so important for investors, you should check out our free report on analyst forecasts for Western Areas.
What Are Current Liabilities, And How Do They Affect Western Areas's ROCE?
Current liabilities include invoices, such as supplier payments, short-term debt, or a tax bill, that need to be paid within 12 months. The ROCE equation subtracts current liabilities from capital employed, so a company with a lot of current liabilities appears to have less capital employed, and a higher ROCE than otherwise. To counter this, investors can check if a company has high current liabilities relative to total assets.
Western Areas has current liabilities of AU$65m and total assets of AU$642m. As a result, its current liabilities are equal to approximately 10% of its total assets. This is a modest level of current liabilities, which would only have a small effect on ROCE.
What We Can Learn From Western Areas's ROCE
With that in mind, we're not overly impressed with Western Areas's ROCE, so it may not be the most appealing prospect. Of course, you might find a fantastic investment by looking at a few good candidates. So take a peek at this free list of companies with modest (or no) debt, trading on a P/E below 20.
If you like to buy stocks alongside management, then you might just love this free list of companies. (Hint: insiders have been buying them).
If you spot an error that warrants correction, please contact the editor at editorial-team@simplywallst.com. This article by Simply Wall St is general in nature. It does not constitute a recommendation to buy or sell any stock, and does not take account of your objectives, or your financial situation. Simply Wall St has no position in the stocks mentioned.
We aim to bring you long-term focused research analysis driven by fundamental data. Note that our analysis may not factor in the latest price-sensitive company announcements or qualitative material. Thank you for reading.
