Do You Like Gr. Sarantis S.A. (ATH:SAR) At This P/E Ratio?

Want to participate in a short research study? Help shape the future of investing tools and you could win a $250 gift card!
This article is written for those who want to get better at using price to earnings ratios (P/E ratios). To keep it practical, we'll show how Gr. Sarantis S.A.'s (ATH:SAR) P/E ratio could help you assess the value on offer. Based on the last twelve months, Gr. Sarantis's P/E ratio is 15.1. That corresponds to an earnings yield of approximately 6.6%.
Check out our latest analysis for Gr. Sarantis
How Do You Calculate A P/E Ratio?
The formula for price to earnings is:
Price to Earnings Ratio = Share Price ÷ Earnings per Share (EPS)
Or for Gr. Sarantis:
P/E of 15.1 = €7.25 ÷ €0.48 (Based on the trailing twelve months to December 2018.)
Is A High Price-to-Earnings Ratio Good?
The higher the P/E ratio, the higher the price tag of a business, relative to its trailing earnings. That isn't necessarily good or bad, but a high P/E implies relatively high expectations of what a company can achieve in the future.
How Growth Rates Impact P/E Ratios
Probably the most important factor in determining what P/E a company trades on is the earnings growth. When earnings grow, the 'E' increases, over time. That means even if the current P/E is high, it will reduce over time if the share price stays flat. And as that P/E ratio drops, the company will look cheap, unless its share price increases.
It's great to see that Gr. Sarantis grew EPS by 15% in the last year. And its annual EPS growth rate over 5 years is 17%. With that performance, you might expect an above average P/E ratio.
Does Gr. Sarantis Have A Relatively High Or Low P/E For Its Industry?
The P/E ratio essentially measures market expectations of a company. We can see in the image below that the average P/E (17.5) for companies in the personal products industry is higher than Gr. Sarantis's P/E.
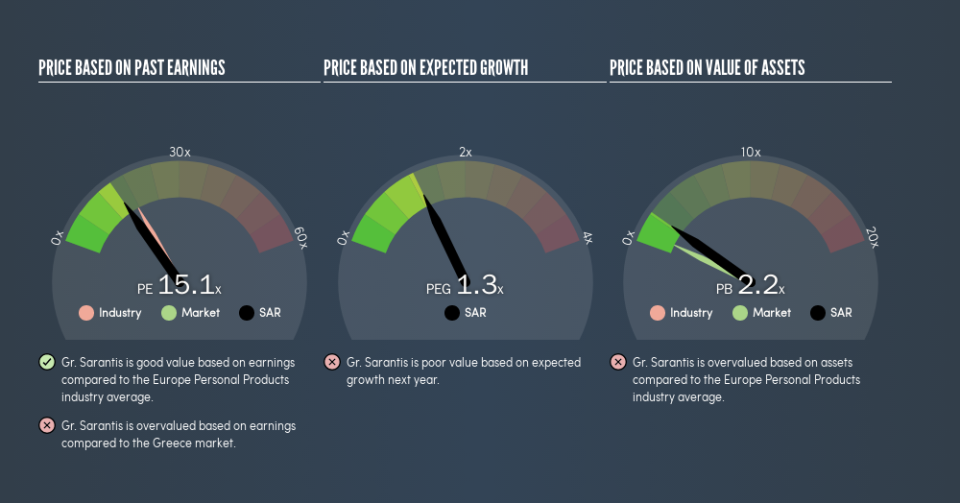
This suggests that market participants think Gr. Sarantis will underperform other companies in its industry. While current expectations are low, the stock could be undervalued if the situation is better than the market assumes. It is arguably worth checking if insiders are buying shares, because that might imply they believe the stock is undervalued.
Don't Forget: The P/E Does Not Account For Debt or Bank Deposits
It's important to note that the P/E ratio considers the market capitalization, not the enterprise value. Thus, the metric does not reflect cash or debt held by the company. The exact same company would hypothetically deserve a higher P/E ratio if it had a strong balance sheet, than if it had a weak one with lots of debt, because a cashed up company can spend on growth.
Such expenditure might be good or bad, in the long term, but the point here is that the balance sheet is not reflected by this ratio.
Gr. Sarantis's Balance Sheet
Gr. Sarantis's net debt is 2.4% of its market cap. It would probably trade on a higher P/E ratio if it had a lot of cash, but I doubt it is having a big impact.
The Bottom Line On Gr. Sarantis's P/E Ratio
Gr. Sarantis's P/E is 15.1 which is about average (14.9) in the GR market. With only modest debt levels, and strong earnings growth, the market seems to doubt that the growth can be maintained. Given analysts are expecting further growth, one might have expected a higher P/E ratio. That may be worth further research.
Investors have an opportunity when market expectations about a stock are wrong. As value investor Benjamin Graham famously said, 'In the short run, the market is a voting machine but in the long run, it is a weighing machine.' So this free visual report on analyst forecasts could hold the key to an excellent investment decision.
Of course, you might find a fantastic investment by looking at a few good candidates. So take a peek at this free list of companies with modest (or no) debt, trading on a P/E below 20.
We aim to bring you long-term focused research analysis driven by fundamental data. Note that our analysis may not factor in the latest price-sensitive company announcements or qualitative material.
If you spot an error that warrants correction, please contact the editor at editorial-team@simplywallst.com. This article by Simply Wall St is general in nature. It does not constitute a recommendation to buy or sell any stock, and does not take account of your objectives, or your financial situation. Simply Wall St has no position in the stocks mentioned. Thank you for reading.
