What Can We Make Of Grange Resources Limited’s (ASX:GRR) High Return On Capital?

Today we are going to look at Grange Resources Limited (ASX:GRR) to see whether it might be an attractive investment prospect. Specifically, we'll consider its Return On Capital Employed (ROCE), since that will give us an insight into how efficiently the business can generate profits from the capital it requires.
First of all, we'll work out how to calculate ROCE. Then we'll compare its ROCE to similar companies. And finally, we'll look at how its current liabilities are impacting its ROCE.
Return On Capital Employed (ROCE): What is it?
ROCE is a metric for evaluating how much pre-tax income (in percentage terms) a company earns on the capital invested in its business. All else being equal, a better business will have a higher ROCE. Overall, it is a valuable metric that has its flaws. Renowned investment researcher Michael Mauboussin has suggested that a high ROCE can indicate that 'one dollar invested in the company generates value of more than one dollar'.
How Do You Calculate Return On Capital Employed?
Analysts use this formula to calculate return on capital employed:
Return on Capital Employed = Earnings Before Interest and Tax (EBIT) ÷ (Total Assets - Current Liabilities)
Or for Grange Resources:
0.23 = AU$124m ÷ (AU$609m - AU$72m) (Based on the trailing twelve months to December 2018.)
So, Grange Resources has an ROCE of 23%.
Check out our latest analysis for Grange Resources
Is Grange Resources's ROCE Good?
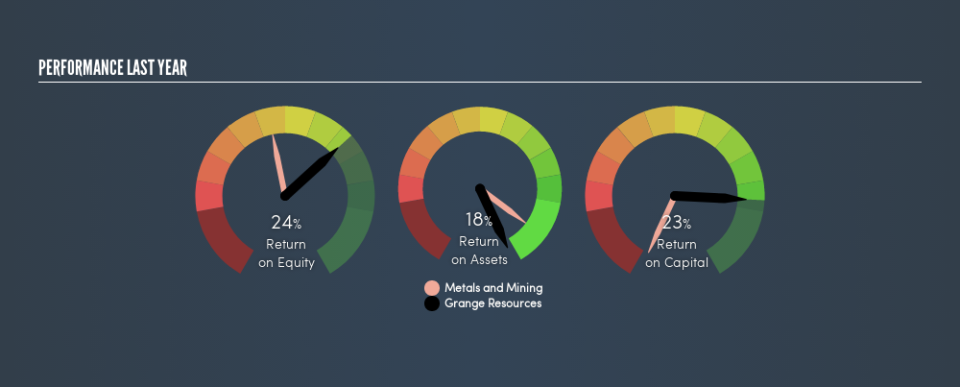
One way to assess ROCE is to compare similar companies. In our analysis, Grange Resources's ROCE is meaningfully higher than the 9.5% average in the Metals and Mining industry. We consider this a positive sign, because it suggests it uses capital more efficiently than similar companies. Setting aside the comparison to its industry for a moment, Grange Resources's ROCE in absolute terms currently looks quite high.
Grange Resources reported an ROCE of 23% -- better than 3 years ago, when the company didn't make a profit. This makes us wonder if the company is improving. The image below shows how Grange Resources's ROCE compares to its industry, and you can click it to see more detail on its past growth.
When considering this metric, keep in mind that it is backwards looking, and not necessarily predictive. ROCE can be deceptive for cyclical businesses, as returns can look incredible in boom times, and terribly low in downturns. ROCE is, after all, simply a snap shot of a single year. Given the industry it operates in, Grange Resources could be considered cyclical. You can check if Grange Resources has cyclical profits by looking at this free graph of past earnings, revenue and cash flow.
How Grange Resources's Current Liabilities Impact Its ROCE
Current liabilities are short term bills and invoices that need to be paid in 12 months or less. Due to the way ROCE is calculated, a high level of current liabilities makes a company look as though it has less capital employed, and thus can (sometimes unfairly) boost the ROCE. To counteract this, we check if a company has high current liabilities, relative to its total assets.
Grange Resources has total liabilities of AU$72m and total assets of AU$609m. As a result, its current liabilities are equal to approximately 12% of its total assets. The fairly low level of current liabilities won't have much impact on the already great ROCE.
Our Take On Grange Resources's ROCE
This is good to see, and with such a high ROCE, Grange Resources may be worth a closer look. Grange Resources shapes up well under this analysis, but it is far from the only business delivering excellent numbers . You might also want to check this free collection of companies delivering excellent earnings growth.
I will like Grange Resources better if I see some big insider buys. While we wait, check out this free list of growing companies with considerable, recent, insider buying.
We aim to bring you long-term focused research analysis driven by fundamental data. Note that our analysis may not factor in the latest price-sensitive company announcements or qualitative material.
If you spot an error that warrants correction, please contact the editor at editorial-team@simplywallst.com. This article by Simply Wall St is general in nature. It does not constitute a recommendation to buy or sell any stock, and does not take account of your objectives, or your financial situation. Simply Wall St has no position in the stocks mentioned. Thank you for reading.
