Is Griffon Corporation’s (NYSE:GFF) ROE Of 4.1% Concerning?

One of the best investments we can make is in our own knowledge and skill set. With that in mind, this article will work through how we can use Return On Equity (ROE) to better understand a business. By way of learning-by-doing, we’ll look at ROE to gain a better understanding of Griffon Corporation (NYSE:GFF).
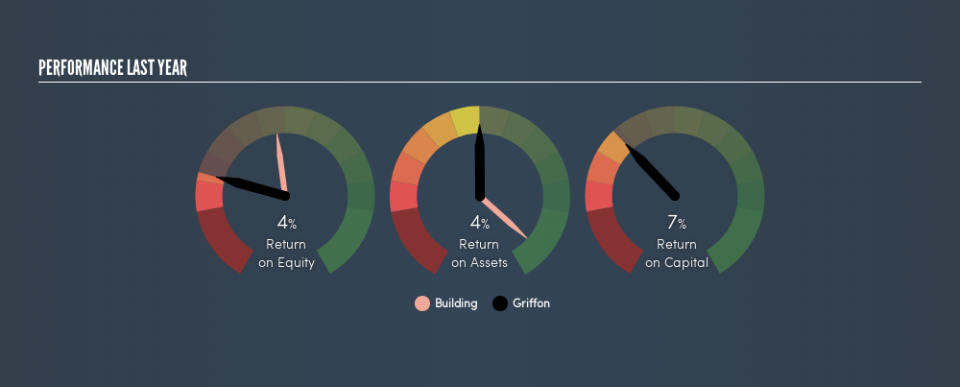
Our data shows Griffon has a return on equity of 4.1% for the last year. One way to conceptualize this, is that for each $1 of shareholders’ equity it has, the company made $0.041 in profit.
See our latest analysis for Griffon
How Do You Calculate Return On Equity?
The formula for ROE is:
Return on Equity = Net Profit ÷ Shareholders’ Equity
Or for Griffon:
4.1% = US$19m ÷ US$472m (Based on the trailing twelve months to December 2018.)
It’s easy to understand the ‘net profit’ part of that equation, but ‘shareholders’ equity’ requires further explanation. It is the capital paid in by shareholders, plus any retained earnings. Shareholders’ equity can be calculated by subtracting the total liabilities of the company from the total assets of the company.
What Does Return On Equity Mean?
Return on Equity measures a company’s profitability against the profit it has kept for the business (plus any capital injections). The ‘return’ is the amount earned after tax over the last twelve months. The higher the ROE, the more profit the company is making. So, as a general rule, a high ROE is a good thing. Clearly, then, one can use ROE to compare different companies.
Does Griffon Have A Good Return On Equity?
Arguably the easiest way to assess company’s ROE is to compare it with the average in its industry. The limitation of this approach is that some companies are quite different from others, even within the same industry classification. If you look at the image below, you can see Griffon has a lower ROE than the average (15%) in the Building industry classification.
That certainly isn’t ideal. It is better when the ROE is above industry average, but a low one doesn’t necessarily mean the business is overpriced. Still, shareholders might want to check if insiders have been selling.
How Does Debt Impact ROE?
Companies usually need to invest money to grow their profits. The cash for investment can come from prior year profits (retained earnings), issuing new shares, or borrowing. In the first and second cases, the ROE will reflect this use of cash for investment in the business. In the latter case, the debt required for growth will boost returns, but will not impact the shareholders’ equity. In this manner the use of debt will boost ROE, even though the core economics of the business stay the same.
Griffon’s Debt And Its 4.1% ROE
Griffon does use a significant amount of debt to increase returns. It has a debt to equity ratio of 2.45. Its ROE is quite low, even with the use of significant debt; that’s not a good result, in my opinion. Investors should think carefully about how a company might perform if it was unable to borrow so easily, because credit markets do change over time.
In Summary
Return on equity is one way we can compare the business quality of different companies. Companies that can achieve high returns on equity without too much debt are generally of good quality. If two companies have around the same level of debt to equity, and one has a higher ROE, I’d generally prefer the one with higher ROE.
But when a business is high quality, the market often bids it up to a price that reflects this. The rate at which profits are likely to grow, relative to the expectations of profit growth reflected in the current price, must be considered, too. So you might want to check this FREE visualization of analyst forecasts for the company.
Of course Griffon may not be the best stock to buy. So you may wish to see this free collection of other companies that have high ROE and low debt.
We aim to bring you long-term focused research analysis driven by fundamental data. Note that our analysis may not factor in the latest price-sensitive company announcements or qualitative material.
If you spot an error that warrants correction, please contact the editor at editorial-team@simplywallst.com. This article by Simply Wall St is general in nature. It does not constitute a recommendation to buy or sell any stock, and does not take account of your objectives, or your financial situation. Simply Wall St has no position in the stocks mentioned. Thank you for reading.
