If You Had Bought AutoCanada (TSE:ACQ) Stock Five Years Ago, You'd Be Sitting On A 72% Loss, Today

AutoCanada Inc. (TSE:ACQ) shareholders will doubtless be very grateful to see the share price up 33% in the last quarter. But don't envy holders -- looking back over 5 years the returns have been really bad. In fact, the share price has declined rather badly, down some 72% in that time. So is the recent increase sufficient to restore confidence in the stock? Not yet. However, in the best case scenario (far from fait accompli), this improved performance might be sustained.
See our latest analysis for AutoCanada
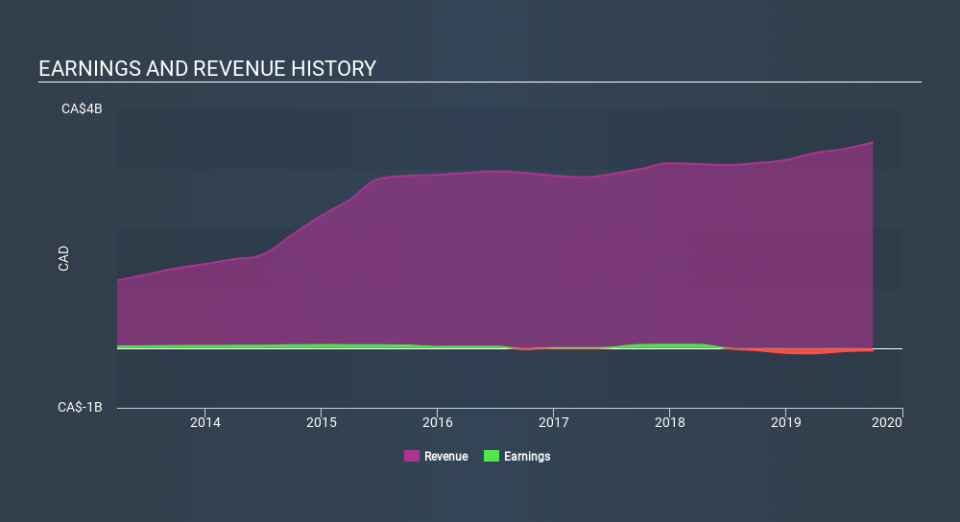
AutoCanada wasn't profitable in the last twelve months, it is unlikely we'll see a strong correlation between its share price and its earnings per share (EPS). Arguably revenue is our next best option. When a company doesn't make profits, we'd generally expect to see good revenue growth. Some companies are willing to postpone profitability to grow revenue faster, but in that case one does expect good top-line growth.
Over five years, AutoCanada grew its revenue at 6.7% per year. That's a pretty good rate for a long time period. So it is unexpected to see the stock down 23% per year in the last five years. The truth is that the growth might be below expectations, and investors are probably worried about the continual losses.
You can see how earnings and revenue have changed over time in the image below (click on the chart to see the exact values).
If you are thinking of buying or selling AutoCanada stock, you should check out this FREE detailed report on its balance sheet.
What About Dividends?
When looking at investment returns, it is important to consider the difference between total shareholder return (TSR) and share price return. The TSR incorporates the value of any spin-offs or discounted capital raisings, along with any dividends, based on the assumption that the dividends are reinvested. It's fair to say that the TSR gives a more complete picture for stocks that pay a dividend. In the case of AutoCanada, it has a TSR of -68% for the last 5 years. That exceeds its share price return that we previously mentioned. And there's no prize for guessing that the dividend payments largely explain the divergence!
A Different Perspective
AutoCanada provided a TSR of 0.9% over the last twelve months. But that return falls short of the market. On the bright side, that's still a gain, and it is certainly better than the yearly loss of about 20% endured over half a decade. It could well be that the business is stabilizing. It's always interesting to track share price performance over the longer term. But to understand AutoCanada better, we need to consider many other factors. For example, we've discovered 3 warning signs for AutoCanada (1 doesn't sit too well with us!) that you should be aware of before investing here.
If you are like me, then you will not want to miss this free list of growing companies that insiders are buying.
Please note, the market returns quoted in this article reflect the market weighted average returns of stocks that currently trade on CA exchanges.
If you spot an error that warrants correction, please contact the editor at editorial-team@simplywallst.com. This article by Simply Wall St is general in nature. It does not constitute a recommendation to buy or sell any stock, and does not take account of your objectives, or your financial situation. Simply Wall St has no position in the stocks mentioned.
We aim to bring you long-term focused research analysis driven by fundamental data. Note that our analysis may not factor in the latest price-sensitive company announcements or qualitative material. Thank you for reading.
