Halma plc's (LON:HLMA) Stock Been Rising: Are Strong Financials Guiding The Market?
Halma's (LON:HLMA) stock is up by 2.8% over the past week. Given that the market rewards strong financials in the long-term, we wonder if that is the case in this instance. Particularly, we will be paying attention to Halma's ROE today.
ROE or return on equity is a useful tool to assess how effectively a company can generate returns on the investment it received from its shareholders. In simpler terms, it measures the profitability of a company in relation to shareholder's equity.
See our latest analysis for Halma
How To Calculate Return On Equity?
The formula for ROE is:
Return on Equity = Net Profit (from continuing operations) ÷ Shareholders' Equity
So, based on the above formula, the ROE for Halma is:
17% = UK£244m ÷ UK£1.4b (Based on the trailing twelve months to March 2022).
The 'return' refers to a company's earnings over the last year. That means that for every £1 worth of shareholders' equity, the company generated £0.17 in profit.
Why Is ROE Important For Earnings Growth?
So far, we've learned that ROE is a measure of a company's profitability. We now need to evaluate how much profit the company reinvests or "retains" for future growth which then gives us an idea about the growth potential of the company. Assuming everything else remains unchanged, the higher the ROE and profit retention, the higher the growth rate of a company compared to companies that don't necessarily bear these characteristics.
Halma's Earnings Growth And 17% ROE
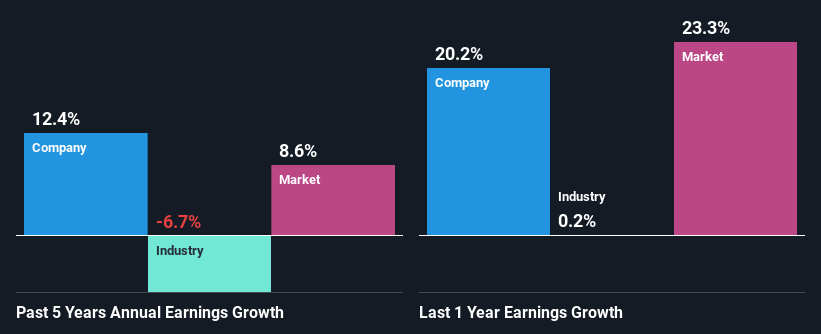
To start with, Halma's ROE looks acceptable. Especially when compared to the industry average of 9.0% the company's ROE looks pretty impressive. This certainly adds some context to Halma's decent 12% net income growth seen over the past five years.
When you consider the fact that the industry earnings have shrunk at a rate of 6.7% in the same period, the company's net income growth is pretty remarkable.
Earnings growth is an important metric to consider when valuing a stock. It’s important for an investor to know whether the market has priced in the company's expected earnings growth (or decline). Doing so will help them establish if the stock's future looks promising or ominous. One good indicator of expected earnings growth is the P/E ratio which determines the price the market is willing to pay for a stock based on its earnings prospects. So, you may want to check if Halma is trading on a high P/E or a low P/E, relative to its industry.
Is Halma Making Efficient Use Of Its Profits?
Halma has a healthy combination of a moderate three-year median payout ratio of 34% (or a retention ratio of 66%) and a respectable amount of growth in earnings as we saw above, meaning that the company has been making efficient use of its profits.
Additionally, Halma has paid dividends over a period of at least ten years which means that the company is pretty serious about sharing its profits with shareholders. Upon studying the latest analysts' consensus data, we found that the company is expected to keep paying out approximately 28% of its profits over the next three years. As a result, Halma's ROE is not expected to change by much either, which we inferred from the analyst estimate of 17% for future ROE.
Conclusion
Overall, we are quite pleased with Halma's performance. In particular, it's great to see that the company is investing heavily into its business and along with a high rate of return, that has resulted in a sizeable growth in its earnings. With that said, the latest industry analyst forecasts reveal that the company's earnings growth is expected to slow down. To know more about the company's future earnings growth forecasts take a look at this free report on analyst forecasts for the company to find out more.
Have feedback on this article? Concerned about the content? Get in touch with us directly. Alternatively, email editorial-team (at) simplywallst.com.
This article by Simply Wall St is general in nature. We provide commentary based on historical data and analyst forecasts only using an unbiased methodology and our articles are not intended to be financial advice. It does not constitute a recommendation to buy or sell any stock, and does not take account of your objectives, or your financial situation. We aim to bring you long-term focused analysis driven by fundamental data. Note that our analysis may not factor in the latest price-sensitive company announcements or qualitative material. Simply Wall St has no position in any stocks mentioned.
Join A Paid User Research Session
You’ll receive a US$30 Amazon Gift card for 1 hour of your time while helping us build better investing tools for the individual investors like yourself. Sign up here
