What Is Hanesbrands's (NYSE:HBI) P/E Ratio After Its Share Price Rocketed?

Those holding Hanesbrands (NYSE:HBI) shares must be pleased that the share price has rebounded 35% in the last thirty days. But unfortunately, the stock is still down by 28% over a quarter. But shareholders may not all be feeling jubilant, since the share price is still down 44% in the last year.
Assuming no other changes, a sharply higher share price makes a stock less attractive to potential buyers. While the market sentiment towards a stock is very changeable, in the long run, the share price will tend to move in the same direction as earnings per share. The implication here is that deep value investors might steer clear when expectations of a company are too high. Perhaps the simplest way to get a read on investors' expectations of a business is to look at its Price to Earnings Ratio (PE Ratio). A high P/E ratio means that investors have a high expectation about future growth, while a low P/E ratio means they have low expectations about future growth.
See our latest analysis for Hanesbrands
How Does Hanesbrands's P/E Ratio Compare To Its Peers?
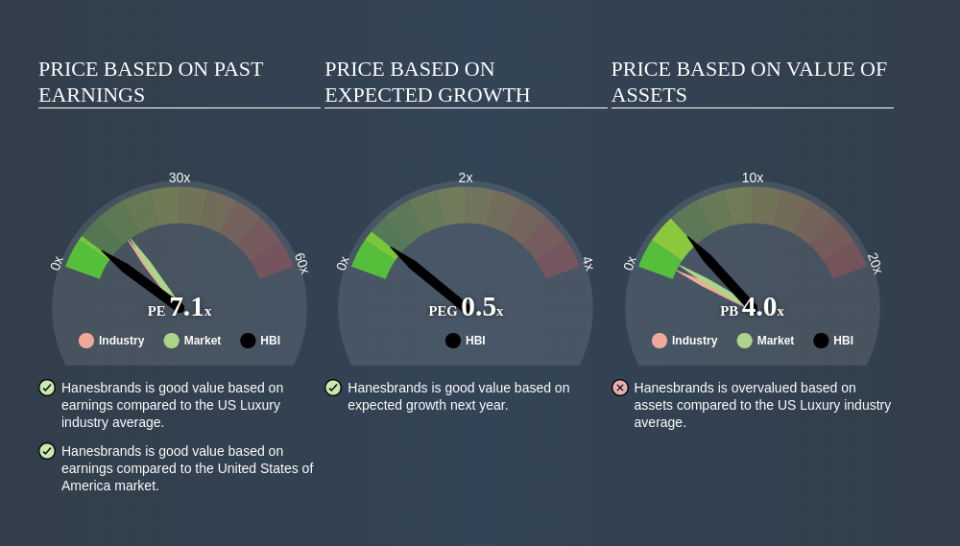
We can tell from its P/E ratio of 7.06 that sentiment around Hanesbrands isn't particularly high. We can see in the image below that the average P/E (14.1) for companies in the luxury industry is higher than Hanesbrands's P/E.
This suggests that market participants think Hanesbrands will underperform other companies in its industry. Many investors like to buy stocks when the market is pessimistic about their prospects. You should delve deeper. I like to check if company insiders have been buying or selling.
How Growth Rates Impact P/E Ratios
P/E ratios primarily reflect market expectations around earnings growth rates. Earnings growth means that in the future the 'E' will be higher. That means unless the share price increases, the P/E will reduce in a few years. Then, a lower P/E should attract more buyers, pushing the share price up.
Hanesbrands saw earnings per share decrease by 5.2% last year. But EPS is up 6.4% over the last 5 years.
Don't Forget: The P/E Does Not Account For Debt or Bank Deposits
Don't forget that the P/E ratio considers market capitalization. In other words, it does not consider any debt or cash that the company may have on the balance sheet. The exact same company would hypothetically deserve a higher P/E ratio if it had a strong balance sheet, than if it had a weak one with lots of debt, because a cashed up company can spend on growth.
Such expenditure might be good or bad, in the long term, but the point here is that the balance sheet is not reflected by this ratio.
How Does Hanesbrands's Debt Impact Its P/E Ratio?
Hanesbrands has net debt worth 99% of its market capitalization. This is a reasonably significant level of debt -- all else being equal you'd expect a much lower P/E than if it had net cash.
The Verdict On Hanesbrands's P/E Ratio
Hanesbrands has a P/E of 7.1. That's below the average in the US market, which is 14.9. When you consider that the company has significant debt, and didn't grow EPS last year, it isn't surprising that the market has muted expectations. What we know for sure is that investors are becoming less uncomfortable about Hanesbrands's prospects, since they have pushed its P/E ratio from 5.2 to 7.1 over the last month. For those who like to invest in turnarounds, that might mean it's time to put the stock on a watchlist, or research it. But others might consider the opportunity to have passed.
Investors should be looking to buy stocks that the market is wrong about. If the reality for a company is not as bad as the P/E ratio indicates, then the share price should increase as the market realizes this. So this free visual report on analyst forecasts could hold the key to an excellent investment decision.
You might be able to find a better buy than Hanesbrands. If you want a selection of possible winners, check out this free list of interesting companies that trade on a P/E below 20 (but have proven they can grow earnings).
If you spot an error that warrants correction, please contact the editor at editorial-team@simplywallst.com. This article by Simply Wall St is general in nature. It does not constitute a recommendation to buy or sell any stock, and does not take account of your objectives, or your financial situation. Simply Wall St has no position in the stocks mentioned.
We aim to bring you long-term focused research analysis driven by fundamental data. Note that our analysis may not factor in the latest price-sensitive company announcements or qualitative material. Thank you for reading.
