Is Hanwell Holdings Limited (SGX:DM0) Struggling With Its 7.9% Return On Capital Employed?

Today we are going to look at Hanwell Holdings Limited (SGX:DM0) to see whether it might be an attractive investment prospect. Specifically, we’ll consider its Return On Capital Employed (ROCE), since that will give us an insight into how efficiently the business can generate profits from the capital it requires.
First, we’ll go over how we calculate ROCE. Second, we’ll look at its ROCE compared to similar companies. Finally, we’ll look at how its current liabilities affect its ROCE.
Return On Capital Employed (ROCE): What is it?
ROCE measures the amount of pre-tax profits a company can generate from the capital employed in its business. Generally speaking a higher ROCE is better. Overall, it is a valuable metric that has its flaws. Renowned investment researcher Michael Mauboussin has suggested that a high ROCE can indicate that ‘one dollar invested in the company generates value of more than one dollar’.
So, How Do We Calculate ROCE?
Analysts use this formula to calculate return on capital employed:
Return on Capital Employed = Earnings Before Interest and Tax (EBIT) ÷ (Total Assets – Current Liabilities)
Or for Hanwell Holdings:
0.079 = S$30m ÷ (S$553m – S$188m) (Based on the trailing twelve months to September 2018.)
Therefore, Hanwell Holdings has an ROCE of 7.9%.
Check out our latest analysis for Hanwell Holdings
Want to help shape the future of investing tools and platforms? Take the survey and be part of one of the most advanced studies of stock market investors to date.
Does Hanwell Holdings Have A Good ROCE?
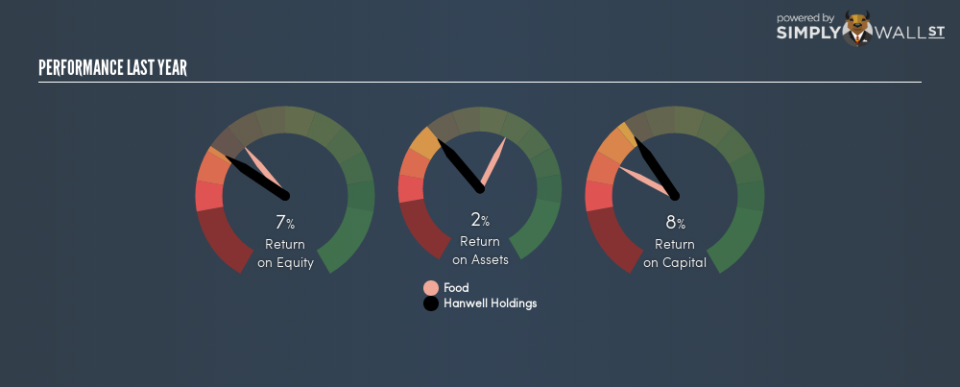
When making comparisons between similar businesses, investors may find ROCE useful. It appears that Hanwell Holdings’s ROCE is fairly close to the Food industry average of 7.6%. Separate from how Hanwell Holdings stacks up against its industry, its ROCE in absolute terms is mediocre; relative to the returns on government bonds. It is possible that there are more rewarding investments out there.
In our analysis, Hanwell Holdings’s ROCE appears to be 7.9%, compared to 3 years ago, when its ROCE was 4.5%. This makes us think about whether the company has been reinvesting shrewdly.
When considering this metric, keep in mind that it is backwards looking, and not necessarily predictive. ROCE can be misleading for companies in cyclical industries, with returns looking impressive during the boom times, but very weak during the busts. ROCE is only a point-in-time measure. How cyclical is Hanwell Holdings? You can see for yourself by looking at this free graph of past earnings, revenue and cash flow.
What Are Current Liabilities, And How Do They Affect Hanwell Holdings’s ROCE?
Liabilities, such as supplier bills and bank overdrafts, are referred to as current liabilities if they need to be paid within 12 months. Due to the way the ROCE equation works, having large bills due in the near term can make it look as though a company has less capital employed, and thus a higher ROCE than usual. To check the impact of this, we calculate if a company has high current liabilities relative to its total assets.
Hanwell Holdings has total liabilities of S$188m and total assets of S$553m. As a result, its current liabilities are equal to approximately 34% of its total assets. Hanwell Holdings’s ROCE is improved somewhat by its moderate amount of current liabilities.
What We Can Learn From Hanwell Holdings’s ROCE
With this level of liabilities and a mediocre ROCE, there are potentially better investments out there. But note: Hanwell Holdings may not be the best stock to buy. So take a peek at this free list of interesting companies with strong recent earnings growth (and a P/E ratio below 20).
For those who like to find winning investments this free list of growing companies with recent insider purchasing, could be just the ticket.
To help readers see past the short term volatility of the financial market, we aim to bring you a long-term focused research analysis purely driven by fundamental data. Note that our analysis does not factor in the latest price-sensitive company announcements.
The author is an independent contributor and at the time of publication had no position in the stocks mentioned. For errors that warrant correction please contact the editor at editorial-team@simplywallst.com.
