What Happens to Stocks After a New S&P High
It's looking like the S&P 500 Index (SPX) could have the best June in more than 60 years. The rally has propelled the index to an all-time high after pulling back more than 6% from the last all-time high at the end of April. This week, as I often do, I'll relate the current environment to past instances, and see how the market performed going forward.
AAII Survey Shows Bearish Bias Among Retail Investors
The American Association of Individual Investors (AAII) puts out a weekly survey which we use to gauge the sentiment of small retail investors. Despite the S&P 500 hitting all-time highs, less than 30% of those surveyed by the AAII are bullish on the stock market. For some perspective, the percentage of bulls have averaged just over 36% since 2010. So, the retail investor is more bearish than usual right now. Before we look at the implications of the AAII survey, first I just want to look at how stocks perform after hitting an all-time high.
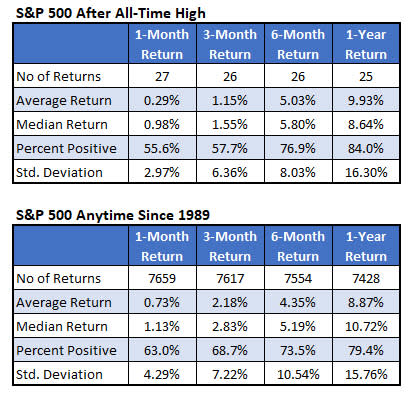
The table below looks at times the S&P 500 hit an all-time high given it was at least a month since the last all-time high, and the index also pulled back at least 5% since the last all-time high. I went back to 1987 since that's when we first have AAII data. The first signal was in 1989, so I have a table since then for comparison.
There have been 27 all-time highs over this time span. Compared to typical returns, after an all-time high you tend to see slight underperformance over the short term (one to three months), but longer-term returns which are similar to typical returns.
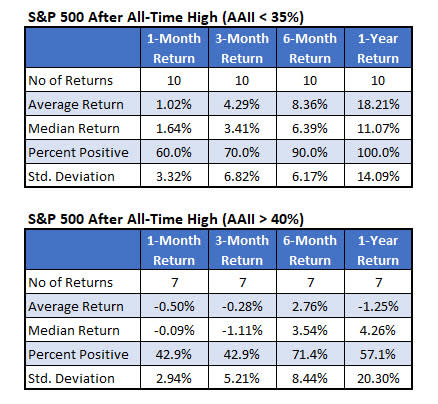
The lack of AAII bulls at the time the index hits an all-time high has been extremely bullish for stocks going forward. The top table below shows how the S&P 500 has performed after these all-time highs when the percentage of bulls is less than 35%. After those 10 instances, the index was up every time, with an average return of 18%. Compare that to when the retail crowd has been bullish (bullish percentage above 40%). In that case, the S&P 500 has been down an average of 1.25% over the next year and positive in four of seven occasions.
Here's a scatter plot in which you can clearly see an inverse correlation between the percentage of bulls in the AAII poll and the return of the S&P 500 Index over the next year. Looking at that trendline, the current bullish percentage is barely below 30%, suggesting an expected return of about 20% over the next year.

Historical Returns After S&P Hits a New High
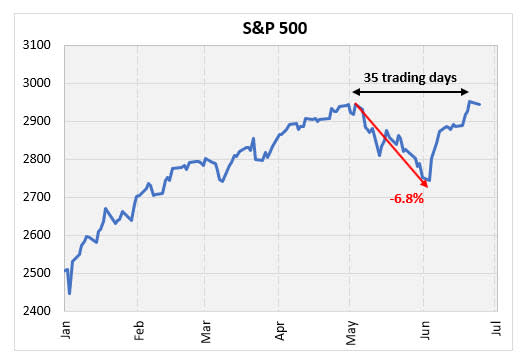
I mentioned above that the S&P 500 was last at an all-time high at the end of April. It was a relatively short time that the market pulled back almost 7% and then made back above the prior high. The chart below shows the sharp pullback and rally occurred in 35 trading days which is about a month and a half.
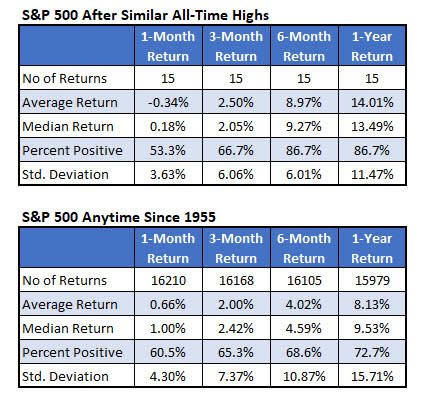
I looked at similar price patterns for the S&P 500 going back to 1950. Specifically, I looked at instances in which the index was at an all-time high and pulled back at least 5% and then overtook that last high somewhere between one and two months.
The first incident of this pattern was 1955. Since then, there have been 15 occurrences. Based on these, it has been a bearish short-term signal, with the next month showing positive returns just over half the time and averaging a slight loss.
Longer term, however, the returns are much more bullish. Six months after a signal, the S&P 500 was up about 87% of the time, averaging a gain of about 9%. The typical six-month return averages a 4% gain, and is positive just under 70% of the time. The three-month returns are similar to typical returns. Furthermore, the market has been positive over the next six months and one year the last 10 times this has occurred (not shown).
Both studies above show the current environment to have bullish implications over the longer term. Hopefully these trends hold up.
