Should You Be Happy With APA Group’s (ASX:APA) Performance Lately?

Examining APA Group’s (ASX:APA) past track record of performance is an insightful exercise for investors. It allows us to reflect on whether or not the company has met or exceed expectations, which is a great indicator for future performance. Today I will assess APA’s latest performance announced on 31 December 2017 and compare these figures to its longer term trend and industry movements. See our latest analysis for APA Group
Did APA perform better than its track record and industry?
I use data from the most recent 12 months, which either annualizes the most recent 6-month earnings update, or in some cases, the most recent annual report is already the latest available financial data. This blend allows me to analyze different companies on a similar basis, using the latest information. For APA Group, its most recent trailing-twelve-month earnings is AU$220.98M, which compared to the previous year’s level, Given that these values are somewhat nearsighted, I’ve calculated an annualized five-year value for APA Group’s net income, which stands at AU$272.61M This means APA Group’s annual earnings on average have historically been larger, which indicates a downward trend in earnings.
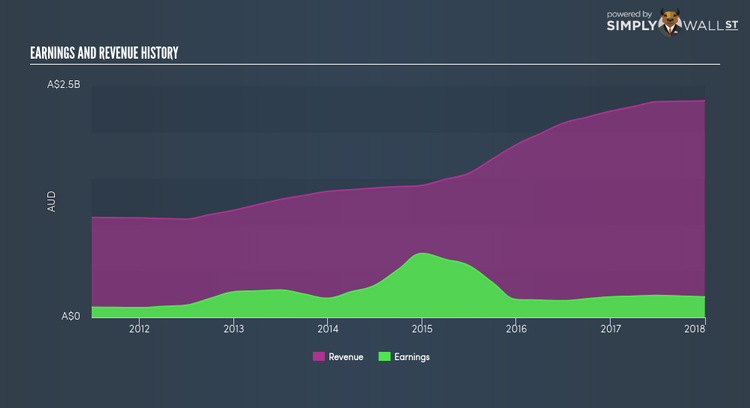
To understand what’s happening, let’s examine what’s transpiring with margins and whether the rest of the industry is facing the same headwind. Revenue growth over the past few years, has been positive, however, earnings growth has not been able to catch up, meaning APA Group has been increasing its expenses by a lot more. This hurts margins and earnings, and is not a sustainable practice. Viewing growth from a sector-level, the Australian gas utilities industry has been growing its average earnings by double-digit 15.92% in the previous year, and a less exciting 5.69% over the past half a decade. This shows that whatever tailwind the industry is enjoying, APA Group has not been able to reap as much as its average peer.
What does this mean?
APA Group’s track record can be a valuable insight into its earnings performance, but it certainly doesn’t tell the whole story. Recent positive growth doesn’t necessarily mean it’s onwards and upwards for the company. There may be variables that are influencing the industry as a whole, thus the high industry growth rate over the same time frame. I recommend you continue to research APA Group to get a more holistic view of the stock by looking at:
Future Outlook: What are well-informed industry analysts predicting for APA’s future growth? Take a look at our free research report of analyst consensus for APA’s outlook.
Financial Health: Is APA’s operations financially sustainable? Balance sheets can be hard to analyze, which is why we’ve done it for you. Check out our financial health checks here.
Other High-Performing Stocks: Are there other stocks that provide better prospects with proven track records? Explore our free list of these great stocks here.
NB: Figures in this article are calculated using data from the trailing twelve months from 31 December 2017. This may not be consistent with full year annual report figures.
To help readers see pass the short term volatility of the financial market, we aim to bring you a long-term focused research analysis purely driven by fundamental data. Note that our analysis does not factor in the latest price sensitive company announcements.
The author is an independent contributor and at the time of publication had no position in the stocks mentioned.
