Is Hawaiian Holdings Inc’s (NASDAQ:HA) Balance Sheet Strong Enough To Weather A Storm?

While small-cap stocks, such as Hawaiian Holdings Inc (NASDAQ:HA) with its market cap of US$1.99B, are popular for their explosive growth, investors should also be aware of their balance sheet to judge whether the company can survive a downturn. So, understanding the company’s financial health becomes crucial, as mismanagement of capital can lead to bankruptcies, which occur at a higher rate for small-caps. I believe these basic checks tell most of the story you need to know. However, this commentary is still very high-level, so I recommend you dig deeper yourself into HA here.
Does HA generate enough cash through operations?
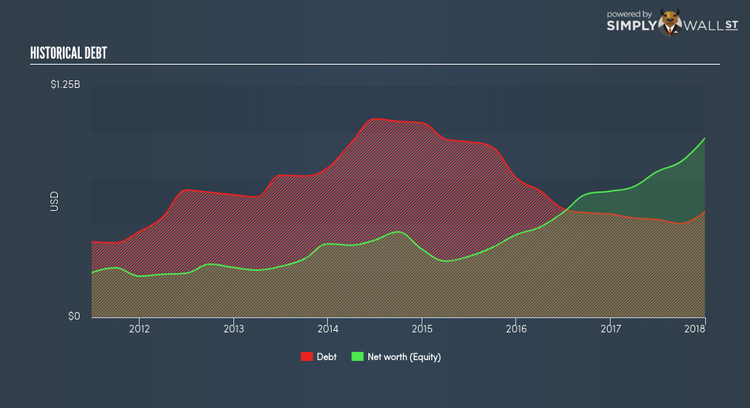
HA’s debt level has been constant at around US$570.67M over the previous year – this includes both the current and long-term debt. At this current level of debt, the current cash and short-term investment levels stands at US$460.25M , ready to deploy into the business. On top of this, HA has generated cash from operations of US$331.14M in the last twelve months, resulting in an operating cash to total debt ratio of 58.03%, signalling that HA’s current level of operating cash is high enough to cover debt. This ratio can also be a sign of operational efficiency as an alternative to return on assets. In HA’s case, it is able to generate 0.58x cash from its debt capital.
Can HA meet its short-term obligations with the cash in hand?
Looking at HA’s most recent US$891.92M liabilities, it appears that the company has not maintained a sufficient level of current assets to meet its obligations, with the current ratio last standing at 0.79x, which is below the prudent industry ratio of 3x.
Does HA face the risk of succumbing to its debt-load?
With debt reaching 59.08% of equity, HA may be thought of as relatively highly levered. This is not uncommon for a small-cap company given that debt tends to be lower-cost and at times, more accessible. We can test if HA’s debt levels are sustainable by measuring interest payments against earnings of a company. Ideally, earnings before interest and tax (EBIT) should cover net interest by at least three times. For HA, the ratio of 30.24x suggests that interest is comfortably covered, which means that debtors may be willing to loan the company more money, giving HA ample headroom to grow its debt facilities.
Next Steps:
Although HA’s debt level is towards the higher end of the spectrum, its cash flow coverage seems adequate to meet debt obligations which means its debt is being efficiently utilised. But, its low liquidity raises concerns over whether current asset management practices are properly implemented for the small-cap. This is only a rough assessment of financial health, and I’m sure HA has company-specific issues impacting its capital structure decisions. I suggest you continue to research Hawaiian Holdings to get a better picture of the stock by looking at:
Future Outlook: What are well-informed industry analysts predicting for HA’s future growth? Take a look at our free research report of analyst consensus for HA’s outlook.
Valuation: What is HA worth today? Is the stock undervalued, even when its growth outlook is factored into its intrinsic value? The intrinsic value infographic in our free research report helps visualize whether HA is currently mispriced by the market.
Other High-Performing Stocks: Are there other stocks that provide better prospects with proven track records? Explore our free list of these great stocks here.
To help readers see pass the short term volatility of the financial market, we aim to bring you a long-term focused research analysis purely driven by fundamental data. Note that our analysis does not factor in the latest price sensitive company announcements.
The author is an independent contributor and at the time of publication had no position in the stocks mentioned.
