Is Headlam Group plc’s (LON:HEAD) Return On Capital Employed Any Good?

Today we'll evaluate Headlam Group plc (LON:HEAD) to determine whether it could have potential as an investment idea. Specifically, we're going to calculate its Return On Capital Employed (ROCE), in the hopes of getting some insight into the business.
First of all, we'll work out how to calculate ROCE. Next, we'll compare it to others in its industry. Then we'll determine how its current liabilities are affecting its ROCE.
What is Return On Capital Employed (ROCE)?
ROCE measures the 'return' (pre-tax profit) a company generates from capital employed in its business. Generally speaking a higher ROCE is better. Ultimately, it is a useful but imperfect metric. Author Edwin Whiting says to be careful when comparing the ROCE of different businesses, since 'No two businesses are exactly alike.
So, How Do We Calculate ROCE?
The formula for calculating the return on capital employed is:
Return on Capital Employed = Earnings Before Interest and Tax (EBIT) ÷ (Total Assets - Current Liabilities)
Or for Headlam Group:
0.14 = UK£42m ÷ (UK£533m - UK£227m) (Based on the trailing twelve months to June 2019.)
Therefore, Headlam Group has an ROCE of 14%.
See our latest analysis for Headlam Group
Does Headlam Group Have A Good ROCE?
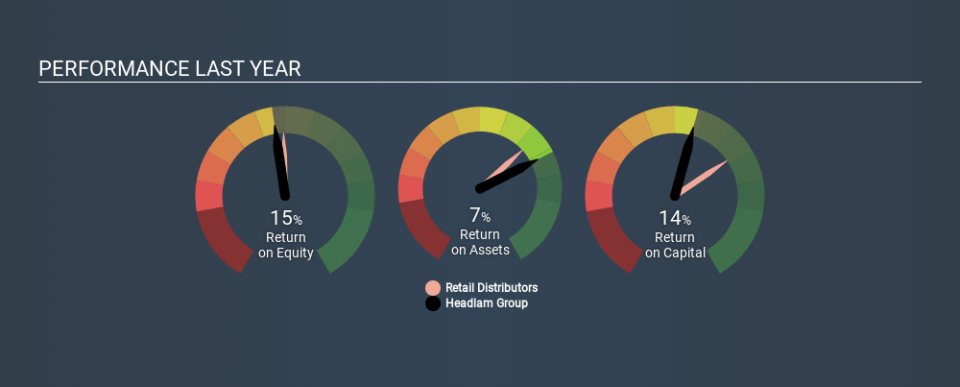
ROCE is commonly used for comparing the performance of similar businesses. We can see Headlam Group's ROCE is around the 14% average reported by the Retail Distributors industry. Independently of how Headlam Group compares to its industry, its ROCE in absolute terms appears decent, and the company may be worthy of closer investigation.
Headlam Group's current ROCE of 14% is lower than its ROCE in the past, which was 19%, 3 years ago. Therefore we wonder if the company is facing new headwinds. You can click on the image below to see (in greater detail) how Headlam Group's past growth compares to other companies.
It is important to remember that ROCE shows past performance, and is not necessarily predictive. ROCE can be misleading for companies in cyclical industries, with returns looking impressive during the boom times, but very weak during the busts. This is because ROCE only looks at one year, instead of considering returns across a whole cycle. What happens in the future is pretty important for investors, so we have prepared a free report on analyst forecasts for Headlam Group.
How Headlam Group's Current Liabilities Impact Its ROCE
Short term (or current) liabilities, are things like supplier invoices, overdrafts, or tax bills that need to be paid within 12 months. Due to the way ROCE is calculated, a high level of current liabilities makes a company look as though it has less capital employed, and thus can (sometimes unfairly) boost the ROCE. To check the impact of this, we calculate if a company has high current liabilities relative to its total assets.
Headlam Group has total assets of UK£533m and current liabilities of UK£227m. As a result, its current liabilities are equal to approximately 43% of its total assets. Headlam Group has a middling amount of current liabilities, increasing its ROCE somewhat.
Our Take On Headlam Group's ROCE
While its ROCE looks good, it's worth remembering that the current liabilities are making the business look better. Headlam Group shapes up well under this analysis, but it is far from the only business delivering excellent numbers . You might also want to check this free collection of companies delivering excellent earnings growth.
For those who like to find winning investments this free list of growing companies with recent insider purchasing, could be just the ticket.
If you spot an error that warrants correction, please contact the editor at editorial-team@simplywallst.com. This article by Simply Wall St is general in nature. It does not constitute a recommendation to buy or sell any stock, and does not take account of your objectives, or your financial situation. Simply Wall St has no position in the stocks mentioned.
We aim to bring you long-term focused research analysis driven by fundamental data. Note that our analysis may not factor in the latest price-sensitive company announcements or qualitative material. Thank you for reading.
