Health Check: How Prudently Does Silk Road Medical (NASDAQ:SILK) Use Debt?
Howard Marks put it nicely when he said that, rather than worrying about share price volatility, 'The possibility of permanent loss is the risk I worry about... and every practical investor I know worries about.' When we think about how risky a company is, we always like to look at its use of debt, since debt overload can lead to ruin. We note that Silk Road Medical, Inc (NASDAQ:SILK) does have debt on its balance sheet. But should shareholders be worried about its use of debt?
Why Does Debt Bring Risk?
Debt assists a business until the business has trouble paying it off, either with new capital or with free cash flow. In the worst case scenario, a company can go bankrupt if it cannot pay its creditors. However, a more frequent (but still costly) occurrence is where a company must issue shares at bargain-basement prices, permanently diluting shareholders, just to shore up its balance sheet. By replacing dilution, though, debt can be an extremely good tool for businesses that need capital to invest in growth at high rates of return. The first thing to do when considering how much debt a business uses is to look at its cash and debt together.
Check out our latest analysis for Silk Road Medical
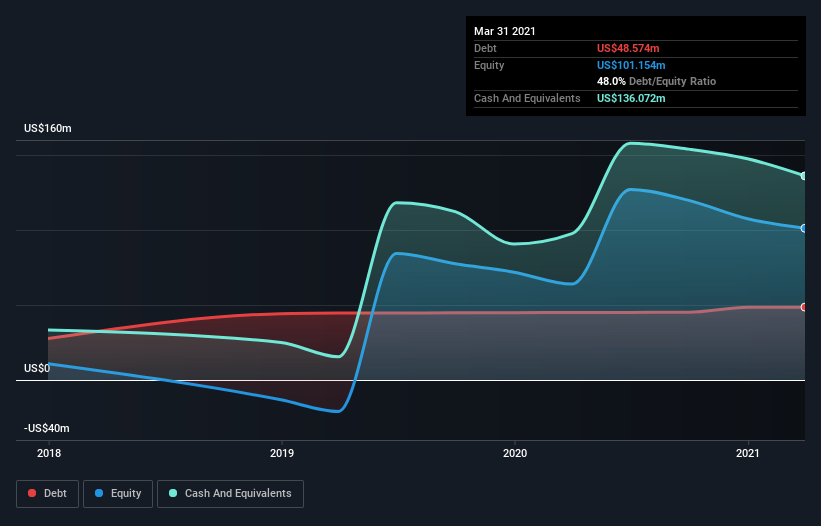
How Much Debt Does Silk Road Medical Carry?
You can click the graphic below for the historical numbers, but it shows that as of March 2021 Silk Road Medical had US$47.7m of debt, an increase on US$45.0m, over one year. However, it does have US$136.1m in cash offsetting this, leading to net cash of US$88.3m.
How Strong Is Silk Road Medical's Balance Sheet?
We can see from the most recent balance sheet that Silk Road Medical had liabilities of US$16.2m falling due within a year, and liabilities of US$52.3m due beyond that. Offsetting this, it had US$136.1m in cash and US$11.1m in receivables that were due within 12 months. So it actually has US$78.7m more liquid assets than total liabilities.
This short term liquidity is a sign that Silk Road Medical could probably pay off its debt with ease, as its balance sheet is far from stretched. Simply put, the fact that Silk Road Medical has more cash than debt is arguably a good indication that it can manage its debt safely. When analysing debt levels, the balance sheet is the obvious place to start. But ultimately the future profitability of the business will decide if Silk Road Medical can strengthen its balance sheet over time. So if you want to see what the professionals think, you might find this free report on analyst profit forecasts to be interesting.
In the last year Silk Road Medical wasn't profitable at an EBIT level, but managed to grow its revenue by 13%, to US$78m. We usually like to see faster growth from unprofitable companies, but each to their own.
So How Risky Is Silk Road Medical?
By their very nature companies that are losing money are more risky than those with a long history of profitability. And we do note that Silk Road Medical had an earnings before interest and tax (EBIT) loss, over the last year. And over the same period it saw negative free cash outflow of US$43m and booked a US$48m accounting loss. While this does make the company a bit risky, it's important to remember it has net cash of US$88.3m. That kitty means the company can keep spending for growth for at least two years, at current rates. Even though its balance sheet seems sufficiently liquid, debt always makes us a little nervous if a company doesn't produce free cash flow regularly. When analysing debt levels, the balance sheet is the obvious place to start. However, not all investment risk resides within the balance sheet - far from it. For instance, we've identified 3 warning signs for Silk Road Medical that you should be aware of.
At the end of the day, it's often better to focus on companies that are free from net debt. You can access our special list of such companies (all with a track record of profit growth). It's free.
This article by Simply Wall St is general in nature. It does not constitute a recommendation to buy or sell any stock, and does not take account of your objectives, or your financial situation. We aim to bring you long-term focused analysis driven by fundamental data. Note that our analysis may not factor in the latest price-sensitive company announcements or qualitative material. Simply Wall St has no position in any stocks mentioned.
Have feedback on this article? Concerned about the content? Get in touch with us directly. Alternatively, email editorial-team (at) simplywallst.com.
