Helen of Troy (HELE) Q2 Earnings & Sales Beat, Stock Down
Helen of Troy Limited HELE released second-quarter fiscal 2020 results, wherein both top and bottom lines increased year over year and beat the Zacks Consensus Estimate. The company has been posting better-than-expected results for quite some time now. Management raised its overall sales and earnings outlook for fiscal 2020.
However, the company lowered its view for the Health & Home segment, which remained soft in the quarter under review as well. Unfavorable currency impacts were also a drag on Helen of Troy’s second-quarter performance. Shares of the company dipped 2.9% in yesterday’s trading session.
Results in Detail
Adjusted earnings from continuing operations improved 13.1% year over year to $2.24 per share, which beat the Zacks Consensus Estimate of $1.77. Improved sales and margins can be attributable to the increase.
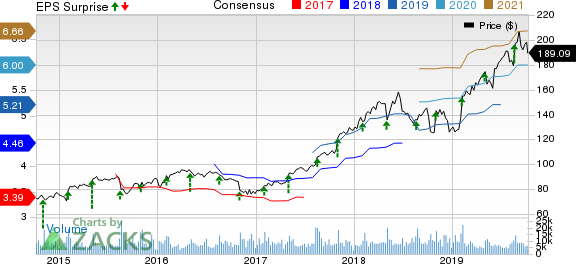
The Estee Lauder Companies Inc. Price, Consensus and EPS Surprise

The Estee Lauder Companies Inc. price-consensus-eps-surprise-chart | The Estee Lauder Companies Inc. Quote
Net sales advanced 5.2% to nearly $414 million and surpassed the Zacks Consensus Estimate of $384 million. The upside was driven by a 5.7% rise in the core business, a 25% increase in online sales and 3.8% growth in Leadership brands.
Notably, core business growth was supported by improved brick and mortar sales in the Housewares unit, solid consolidated online sales and strong appliance sales in the Beauty division. These were offset by soft Health & Home segment sales and sluggishness in the personal care business in the Beauty segment. Additionally, an unfavorable currency movement was a hindrance to the tune of about $1.9 million.
Consolidated gross margin improved 3.6 percentage points (or 50 basis points) to 43%, courtesy of an increased mix of Housewares sales, tariff exclusion refunds and favorable shipment mix. This was partly countered by adverse currency fluctuations, increased inbound freight costs, a smaller mix of personal care sales, and tariff and related pricing impacts.
Adjusted operating income improved 10.4% to $65.8 million and the adjusted operating margin rose 0.8 percentage points to 15.9%.
Segment Performance
Net sales in the Housewares segment advanced 22.1% to $167.9 million, courtesy of growth in point of sale, increased distribution with brick and mortar customers, higher online sales, improved international sales and innovation. These positives were somewhat offset by currency headwinds of about 0.3%. Adjusted operating income in the unit improved 22.1% and the adjusted operating margin was flat at 22.4%.
Net sales in the Health & Home segment declined 9.7% to $158.8 million mainly due to a decline in the core business. Adjusted operating income fell 4.1%, while adjusted operating margin expanded 70 basis points (bps).
Sales in the Beauty segment improved 8.8% to $87.3 million, owing to solid demand and new products in the appliance business, and strong online and international sales. The upside was countered by reduced brick and mortar sales and softness in the personal care business. Adjusted operating income rose 1.3% and while the adjusted operating margin contracted 90 bps.
Other Financial Details & Developments
Helen of Troy ended the quarter with cash and cash equivalents of $17 million and total debt of $301.2 million.
Net cash from operating activities during the first six months of fiscal 2020 came in at $38.2 million.
Fiscal 2020 Outlook
Management is impressed with the company’s second-quarter performance, marked by core sales growth, solid adjusted earnings per share increase and enhanced operating margin. This indicates that the company’s growth investments and digital efforts are yielding results. Further, Helen of Troy is on track with Phase II of its Transformation plan.
Given a robust first half and solid expectations for the remaining part of fiscal 2020, management raised its guidance. Consolidated net sales are now projected to be $1.610-$1.640 billion, indicating growth of 2.9-4.8%. Earlier, the company expected consolidated net sales growth of 1.7-3.6%.
Sales in the Housewares unit are expected to grow 13-15% now compared with 6-8% growth projected earlier. Health & Home net sales are now anticipated to decline low-single digits against the previous expectation of 2-3% growth. Beauty segment net sales are likely to rise low-single digits versus a low–single-digit drop forecasted earlier.
Finally, adjusted earnings from continuing operations are projected to be $8.5-$8.75 per share compared with the earlier view of $8.40-$8.65. The Zacks Consensus Estimate for fiscal 2020 earnings is currently pegged at $8.53.
Price Performance
Shares of this Zacks Rank #3 (Hold) company have gained 30.2% in the past six months compared with the industry’s growth of 14.4%.
Don’t Miss These Cosmetic Stocks
e.l.f. Beauty, Inc. ELF, with a Zacks Rank #1 (Strong Buy), has an impressive earnings surprise record. You can see the complete list of today’s Zacks #1 Rank stocks here.
Estee Lauder EL, with a Zacks Rank #2 (Buy), has a long-term earnings per share growth rate of 12.7%.
Avon Products AVP, also with a Zacks Rank #2, has a long-term earnings per share growth rate of 7.5%.
Today's Best Stocks from Zacks
Would you like to see the updated picks from our best market-beating strategies? From 2017 through 2018, while the S&P 500 gained +15.8%, five of our screens returned +38.0%, +61.3%, +61.6%, +68.1%, and +98.3%.
This outperformance has not just been a recent phenomenon. From 2000 – 2018, while the S&P averaged +4.8% per year, our top strategies averaged up to +56.2% per year.
See their latest picks free >>
Want the latest recommendations from Zacks Investment Research? Today, you can download 7 Best Stocks for the Next 30 Days. Click to get this free report
Helen of Troy Limited (HELE) : Free Stock Analysis Report
e.l.f. Beauty Inc. (ELF) : Free Stock Analysis Report
The Estee Lauder Companies Inc. (EL) : Free Stock Analysis Report
Avon Products, Inc. (AVP) : Free Stock Analysis Report
To read this article on Zacks.com click here.
Zacks Investment Research
