Helen of Troy's (HELE) Q1 Earnings Top Estimates, Sales Up Y/Y
Helen of Troy Limited HELE reported impressive first-quarter fiscal 2022 results, with the top and the bottom line beating the Zacks Consensus Estimate as well as increasing year over year. Strength in Leadership Brands and higher online sales were tailwinds in the quarter. The Beauty and Houseware segments saw improvement on the back of decent traffic as stores reopened. The Health & Home segment also fared well, despite tough year-over-year comparison.
Management stated that as part of its focus on Leadership Brands, the company divested its Personal Care business (excluding the Latin America and Caribbean regions) to HRB Brands LLC for $44.7 million in cash on Jun 7, 2021. The company is focused on its Phase II Transformation plan. In this regard, Helen of Troy finalized a land purchase in Gallaway, Tennessee to construct a state-of-the-art distribution center.
Helen of Troy Limited Price, Consensus and EPS Surprise
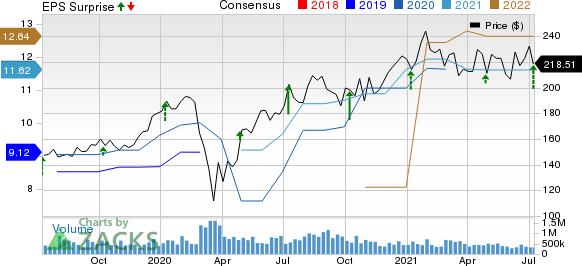
Helen of Troy Limited price-consensus-eps-surprise-chart | Helen of Troy Limited Quote
Results in Detail
Adjusted earnings (including non-cash share-based compensation) came in at $2.95 per share. Excluding the same, the metric came in at $3.48 per share, up 37.5% year over year. The upside can be mainly attributed to increased adjusted operating income in the Beauty and Housewares units along with lower interest expenses. Reduction in weighted average diluted shares outstanding also led to the upside. These were somewhat countered by lower adjusted operating income in the Health & Home segment as well as increased tax expenses. The Zacks Consensus Estimate for fiscal first-quarter earnings was pegged at $2.61 per share.
Consolidated net sales advanced 28.6% year over year to $541.2 million. The metric surpassed the consensus mark of $443.5 million. The year-over-year uptick was driven by an increase of 27.3% in organic business sales mainly on the back of increased consolidated brick and mortar sales in the Beauty and Housewares units, higher consolidated international sales as well as escalated sales in the club and closeout channels. Increased online sales and favorable foreign currency translations were also an upside. Positive shift in unshipped orders worth $15 million from preceding quarter due to winter storm Uri to the quarter under review was another positive. These were somewhat countered by declines in the Non-Core business.
During the quarter, Leadership Brands net sales jumped 22.9% and online sales rose nearly 4%. Core business saw net sales advancement of 28.9%.
Consolidated gross profit margin moved down 1.8 percentage points to 40.8%, mainly due to higher inbound freight expenses stemming from increased freight costs and container supply shortages. Unfavorable channel mix in the Housewares segment and Environmental Protection Agency (EPA) compliance costs in the Health & Home segment also caused the downside. Nevertheless, favorable product mix in the Beauty segment offered some respite.
Adjusted operating income surged 33.6% to $95 million, while adjusted operating margin expanded 0.6 percentage points to 17.5%. The upside was driven by favorable product mix in the Beauty unit and healthy operating leverage. Lower royalty costs and bad debt expense were other tailwinds. These were offset by higher inbound freight costs, unfavorable channel mix in the Housewares unit and increased distribution expenses among other reasons.

Image Source: Zacks Investment Research
Segmental Performance
Net sales in the Housewares segment increased 37.7% to $193.6 million driven by growth of 37.1% in organic business. Organic growth was backed by increased brick and mortar sales for OXO and Hydro Flask. Also, higher sales in international as well as club and closeout channels among others reasons contributed to the same. These were partly offset by reduced online sales stemming from unfavorable year-over-year comparison due to spike in digital sales in the year-ago quarter amid pandemic-led store closures.
Net sales in the Health & Home segment rose 2.1% to $204.1 million, thanks to organic business growth of 0.6%. Organic sales were mainly backed by higher air filtration category sales and increased international sales. Also, positive shift of unshipped orders from preceding quarter due to winter storm Uri to the quarter under review was an upside. In the year-ago quarter, management witnessed massive spike in pandemic-induced demand for healthcare and healthy living products.
Sales in the Beauty segment rallied 78.8% to $143.5 million on contributions from organic business growth of 76.7%. Higher brick and mortar sales, growth in the volumizer franchise, accelerated distribution, new product launches and solid sales for Drybar Products led to the uptick. That being said, declines in the Non-Core business were a downside.
Other Financial Details
Helen of Troy ended the quarter with cash and cash equivalents of $37.4 million as well as total short- and long-term debt of $511 million. Net cash used by operating activities for three months ended May 31, 2021 was $63.4 million. The company repurchased 436,842 shares worth $95.5 million during the quarter.
In fiscal 2022, management expects to incur capital asset expenditures in the range of $100-$125 million. This includes the envisioned initial expenses associated with the development of the aforementioned distribution center.
Fiscal 2022 Guidance
For fiscal 2022, management anticipates consolidated net sales between $1.93 billion and $1.98 billion, suggesting year-over-year decline of 8% to 5.5%. Helen of Troy envisions Core net sales in the band of $1.9-$1.95 billion, indicating decline of 6-3.5%.
Net sales view is based on the assumption that the company’s Health & Home segment net sales will fall 27-24%. Nevertheless, management expects Housewares net sales to grow 7-9%. Net sales in the Beauty segment are projected to improve 4.2-6.3% in fiscal 2022.
The company expects consolidated adjusted earnings per share (EPS) in the range of $10.46-$10.97. Core adjusted EPS is projected in the band of $10.25-$10.75. Management expects Core adjusted EPS to decline 7-2.5%, including impact of EPA matter. The company projects year-over-year inflationary cost pressures of $55-$60 million in fiscal 2022.
Price Performance
Shares of this Zacks Rank #3 (Hold) company have gained 0.2% in the past three months compared with the industry’s rise of 6.9%.
Better-Ranked Staple Picks
Nu Skin Enterprises, Inc. NUS, currently carrying a Zacks Rank #2 (Buy), has a trailing four-quarter earnings surprise of 18.8%, on average. You can see the complete list of today’s Zacks #1 Rank (Strong Buy) stocks here.
Darling Ingredients Inc. DAR, currently sporting a Zacks Rank #1, has a trailing four-quarter earnings surprise of 29.8%, on average.
Medifast, Inc. MED, currently carrying a Zacks Rank #2, has a trailing four-quarter earnings surprise of 12.7%, on average.
Breakout Biotech Stocks with Triple-Digit Profit Potential
The biotech sector is projected to surge beyond $775 billion by 2024 as scientists develop treatments for thousands of diseases. They’re also finding ways to edit the human genome to literally erase our vulnerability to these diseases.
Zacks has just released Century of Biology: 7 Biotech Stocks to Buy Right Now to help investors profit from 7 stocks poised for outperformance. Our recent biotech recommendations have produced gains of +50%, +83% and +164% in as little as 2 months. The stocks in this report could perform even better.
See these 7 breakthrough stocks now>>
Want the latest recommendations from Zacks Investment Research? Today, you can download 7 Best Stocks for the Next 30 Days. Click to get this free report
Darling Ingredients Inc. (DAR) : Free Stock Analysis Report
Helen of Troy Limited (HELE) : Free Stock Analysis Report
Nu Skin Enterprises, Inc. (NUS) : Free Stock Analysis Report
MEDIFAST INC (MED) : Free Stock Analysis Report
To read this article on Zacks.com click here.
Zacks Investment Research
