Is Helical plc (LON:HLCL) A Great Dividend Stock?

Is Helical plc (LON:HLCL) a good dividend stock? How can we tell? Dividend paying companies with growing earnings can be highly rewarding in the long term. Yet sometimes, investors buy a stock for its dividend and lose money because the share price falls by more than they earned in dividend payments.
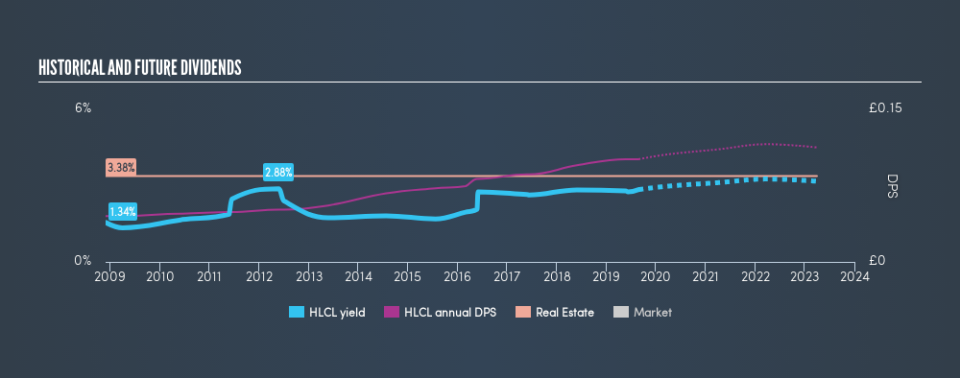
A slim 2.8% yield is hard to get excited about, but the long payment history is respectable. At the right price, or with strong growth opportunities, Helical could have potential. Some simple analysis can reduce the risk of holding Helical for its dividend, and we'll focus on the most important aspects below.
Click the interactive chart for our full dividend analysis
Payout ratios
Dividends are usually paid out of company earnings. If a company is paying more than it earns, then the dividend might become unsustainable - hardly an ideal situation. Comparing dividend payments to a company's net profit after tax is a simple way of reality-checking whether a dividend is sustainable. Looking at the data, we can see that 28% of Helical's profits were paid out as dividends in the last 12 months. This is a middling range that strikes a nice balance between paying dividends to shareholders, and retaining enough earnings to invest in future growth. One of the risks is that management reinvests the retained capital poorly instead of paying a higher dividend.
In addition to comparing dividends against profits, we should inspect whether the company generated enough cash to pay its dividend. Helical paid out 51% of its free cash flow last year, which is acceptable, but is starting to limit the amount of earnings that can be reinvested into the business. It's encouraging to see that the dividend is covered by both profit and cash flow. This generally suggests the dividend is sustainable, as long as earnings don't drop precipitously.
Is Helical's Balance Sheet Risky?
As Helical has a meaningful amount of debt, we need to check its balance sheet to see if the company might have debt risks. A rough way to check this is with these two simple ratios: a) net debt divided by EBITDA (earnings before interest, tax, depreciation and amortisation), and b) net interest cover. Net debt to EBITDA measures total debt load relative to company earnings (lower = less debt), while net interest cover measures the ability to pay interest on the debt (higher = greater ability to pay interest costs). With a net debt to EBITDA ratio of 25.61 times, Helical is very highly levered. While this debt might be serviceable, we would still say it carries substantial risk for the investor who hopes to live on the dividend.
Net interest cover can be calculated by dividing earnings before interest and tax (EBIT) by the company's net interest expense. Helical has interest cover of less than 1 - which suggests its earnings are not high enough to cover even the interest payments on its debt. This is potentially quite serious, and we would likely avoid the stock if it were not resolved quickly. Low interest cover and high debt can create problems right when the investor least needs them, and we're reluctant to rely on the dividend of companies with these traits.
We update our data on Helical every 24 hours, so you can always get our latest analysis of its financial health, here.
Dividend Volatility
One of the major risks of relying on dividend income, is the potential for a company to struggle financially and cut its dividend. Not only is your income cut, but the value of your investment declines as well - nasty. Helical has been paying dividends for a long time, but for the purpose of this analysis, we only examine the past 10 years of payments. The dividend has been stable over the past 10 years, which is great. We think this could suggest some resilience to the business and its dividends. During the past ten-year period, the first annual payment was UK£0.045 in 2009, compared to UK£0.10 last year. Dividends per share have grown at approximately 8.4% per year over this time.
Dividends have grown at a reasonable rate over this period, and without any major cuts in the payment over time, we think this is an attractive combination.
Dividend Growth Potential
While dividend payments have been relatively reliable, it would also be nice if earnings per share (EPS) were growing, as this is essential to maintaining the dividend's purchasing power over the long term. Helical's earnings per share have shrunk at 14% a year over the past five years. A sharp decline in earnings per share is not great from from a dividend perspective, as even conservative payout ratios can come under pressure if earnings fall far enough.
Conclusion
Dividend investors should always want to know if a) a company's dividends are affordable, b) if there is a track record of consistent payments, and c) if the dividend is capable of growing. Helical's dividend payout ratios are within normal bounds, although we note its cash flow is not as strong as the income statement would suggest. Second, it has a limited history of earnings per share growth, but at least the dividends have been relatively stable. While we're not hugely bearish on it, overall we think there are potentially better dividend stocks than Helical out there.
Without at least some growth in earnings per share over time, the dividend will eventually come under pressure either from costs or inflation. Businesses can change though, and we think it would make sense to see what analysts are forecasting for the company.
Looking for more high-yielding dividend ideas? Try our curated list of dividend stocks with a yield above 3%.
We aim to bring you long-term focused research analysis driven by fundamental data. Note that our analysis may not factor in the latest price-sensitive company announcements or qualitative material.
If you spot an error that warrants correction, please contact the editor at editorial-team@simplywallst.com. This article by Simply Wall St is general in nature. It does not constitute a recommendation to buy or sell any stock, and does not take account of your objectives, or your financial situation. Simply Wall St has no position in the stocks mentioned. Thank you for reading.
