Here's What Australian Pharmaceutical Industries Limited's (ASX:API) P/E Ratio Is Telling Us

This article is for investors who would like to improve their understanding of price to earnings ratios (P/E ratios). We'll show how you can use Australian Pharmaceutical Industries Limited's (ASX:API) P/E ratio to inform your assessment of the investment opportunity. Australian Pharmaceutical Industries has a P/E ratio of 14.51, based on the last twelve months. That means that at current prices, buyers pay A$14.51 for every A$1 in trailing yearly profits.
Check out our latest analysis for Australian Pharmaceutical Industries
How Do You Calculate A P/E Ratio?
The formula for price to earnings is:
Price to Earnings Ratio = Price per Share ÷ Earnings per Share (EPS)
Or for Australian Pharmaceutical Industries:
P/E of 14.51 = A$1.4 ÷ A$0.096 (Based on the trailing twelve months to February 2019.)
Is A High Price-to-Earnings Ratio Good?
A higher P/E ratio implies that investors pay a higher price for the earning power of the business. That isn't a good or a bad thing on its own, but a high P/E means that buyers have a higher opinion of the business's prospects, relative to stocks with a lower P/E.
How Does Australian Pharmaceutical Industries's P/E Ratio Compare To Its Peers?
We can get an indication of market expectations by looking at the P/E ratio. If you look at the image below, you can see Australian Pharmaceutical Industries has a lower P/E than the average (17.6) in the healthcare industry classification.
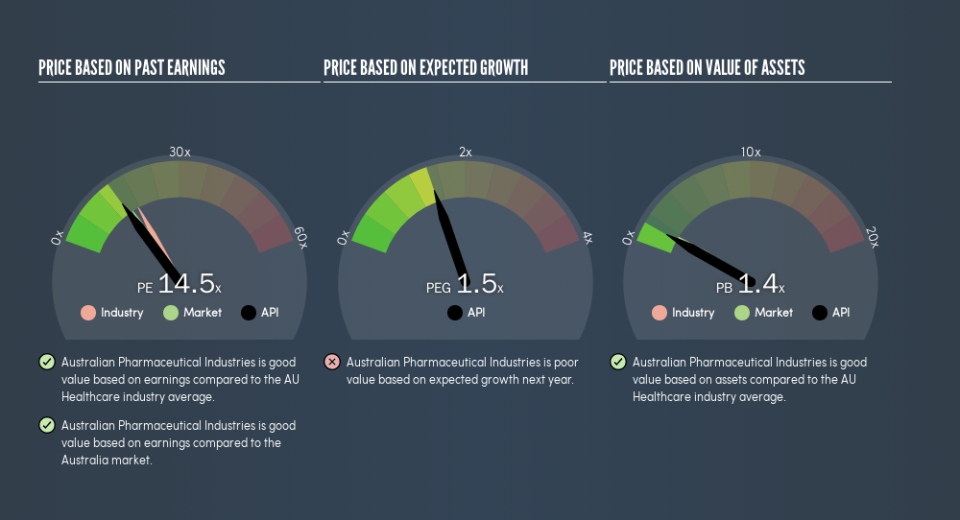
Australian Pharmaceutical Industries's P/E tells us that market participants think it will not fare as well as its peers in the same industry. While current expectations are low, the stock could be undervalued if the situation is better than the market assumes. It is arguably worth checking if insiders are buying shares, because that might imply they believe the stock is undervalued.
How Growth Rates Impact P/E Ratios
Earnings growth rates have a big influence on P/E ratios. Earnings growth means that in the future the 'E' will be higher. Therefore, even if you pay a high multiple of earnings now, that multiple will become lower in the future. So while a stock may look expensive based on past earnings, it could be cheap based on future earnings.
Australian Pharmaceutical Industries shrunk earnings per share by 2.1% last year. But it has grown its earnings per share by 1.6% per year over the last three years.
A Limitation: P/E Ratios Ignore Debt and Cash In The Bank
The 'Price' in P/E reflects the market capitalization of the company. So it won't reflect the advantage of cash, or disadvantage of debt. Theoretically, a business can improve its earnings (and produce a lower P/E in the future) by investing in growth. That means taking on debt (or spending its cash).
Spending on growth might be good or bad a few years later, but the point is that the P/E ratio does not account for the option (or lack thereof).
Australian Pharmaceutical Industries's Balance Sheet
Australian Pharmaceutical Industries has net debt equal to 38% of its market cap. You'd want to be aware of this fact, but it doesn't bother us.
The Bottom Line On Australian Pharmaceutical Industries's P/E Ratio
Australian Pharmaceutical Industries trades on a P/E ratio of 14.5, which is fairly close to the AU market average of 15.7. When you consider the lack of EPS growth last year (along with some debt), it seems the market is optimistic about the future for the business.
Investors should be looking to buy stocks that the market is wrong about. If the reality for a company is not as bad as the P/E ratio indicates, then the share price should increase as the market realizes this. So this free visual report on analyst forecasts could hold the key to an excellent investment decision.
Of course you might be able to find a better stock than Australian Pharmaceutical Industries. So you may wish to see this free collection of other companies that have grown earnings strongly.
We aim to bring you long-term focused research analysis driven by fundamental data. Note that our analysis may not factor in the latest price-sensitive company announcements or qualitative material.
If you spot an error that warrants correction, please contact the editor at editorial-team@simplywallst.com. This article by Simply Wall St is general in nature. It does not constitute a recommendation to buy or sell any stock, and does not take account of your objectives, or your financial situation. Simply Wall St has no position in the stocks mentioned. Thank you for reading.
