Here's What Caesarstone Ltd.'s (NASDAQ:CSTE) P/E Is Telling Us

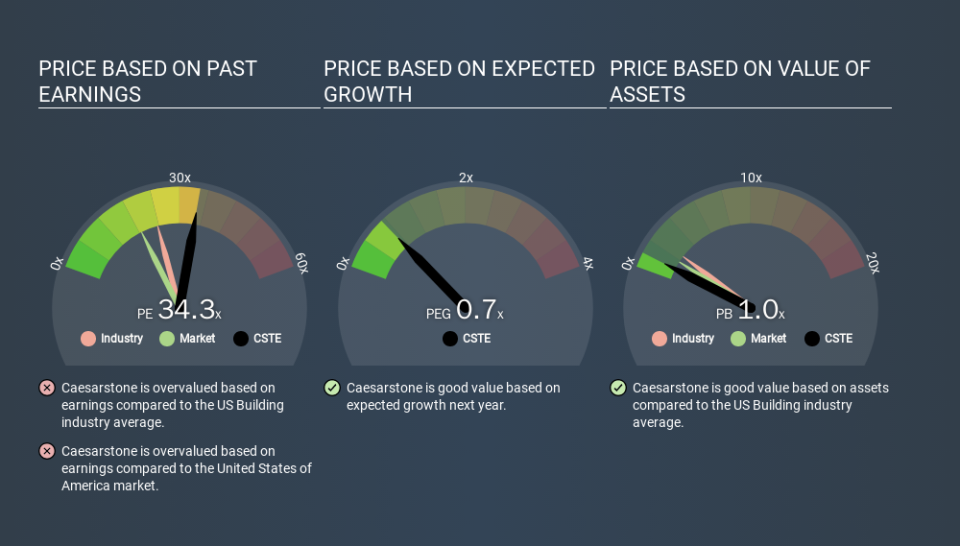
This article is written for those who want to get better at using price to earnings ratios (P/E ratios). To keep it practical, we'll show how Caesarstone Ltd.'s (NASDAQ:CSTE) P/E ratio could help you assess the value on offer. Based on the last twelve months, Caesarstone's P/E ratio is 34.27. In other words, at today's prices, investors are paying $34.27 for every $1 in prior year profit.
See our latest analysis for Caesarstone
How Do I Calculate A Price To Earnings Ratio?
The formula for P/E is:
Price to Earnings Ratio = Price per Share ÷ Earnings per Share (EPS)
Or for Caesarstone:
P/E of 34.27 = USD14.56 ÷ USD0.42 (Based on the trailing twelve months to September 2019.)
Is A High Price-to-Earnings Ratio Good?
A higher P/E ratio means that investors are paying a higher price for each USD1 of company earnings. That is not a good or a bad thing per se, but a high P/E does imply buyers are optimistic about the future.
How Does Caesarstone's P/E Ratio Compare To Its Peers?
We can get an indication of market expectations by looking at the P/E ratio. The image below shows that Caesarstone has a higher P/E than the average (23.6) P/E for companies in the building industry.
Its relatively high P/E ratio indicates that Caesarstone shareholders think it will perform better than other companies in its industry classification. Clearly the market expects growth, but it isn't guaranteed. So further research is always essential. I often monitor director buying and selling.
How Growth Rates Impact P/E Ratios
Companies that shrink earnings per share quickly will rapidly decrease the 'E' in the equation. Therefore, even if you pay a low multiple of earnings now, that multiple will become higher in the future. So while a stock may look cheap based on past earnings, it could be expensive based on future earnings.
Caesarstone shrunk earnings per share by 12% over the last year. And it has shrunk its earnings per share by 28% per year over the last five years. This might lead to muted expectations.
Don't Forget: The P/E Does Not Account For Debt or Bank Deposits
It's important to note that the P/E ratio considers the market capitalization, not the enterprise value. That means it doesn't take debt or cash into account. In theory, a company can lower its future P/E ratio by using cash or debt to invest in growth.
Spending on growth might be good or bad a few years later, but the point is that the P/E ratio does not account for the option (or lack thereof).
So What Does Caesarstone's Balance Sheet Tell Us?
With net cash of US$116m, Caesarstone has a very strong balance sheet, which may be important for its business. Having said that, at 23% of its market capitalization the cash hoard would contribute towards a higher P/E ratio.
The Bottom Line On Caesarstone's P/E Ratio
Caesarstone's P/E is 34.3 which is above average (18.6) in its market. Falling earnings per share is probably keeping traditional value investors away, but the net cash position means the company has time to improve: and the high P/E suggests the market thinks it will.
When the market is wrong about a stock, it gives savvy investors an opportunity. As value investor Benjamin Graham famously said, 'In the short run, the market is a voting machine but in the long run, it is a weighing machine. So this free report on the analyst consensus forecasts could help you make a master move on this stock.
You might be able to find a better buy than Caesarstone. If you want a selection of possible winners, check out this free list of interesting companies that trade on a P/E below 20 (but have proven they can grow earnings).
If you spot an error that warrants correction, please contact the editor at editorial-team@simplywallst.com. This article by Simply Wall St is general in nature. It does not constitute a recommendation to buy or sell any stock, and does not take account of your objectives, or your financial situation. Simply Wall St has no position in the stocks mentioned.
We aim to bring you long-term focused research analysis driven by fundamental data. Note that our analysis may not factor in the latest price-sensitive company announcements or qualitative material. Thank you for reading.
