Here's How We Evaluate The Chemours Company's (NYSE:CC) Dividend

Dividend paying stocks like The Chemours Company (NYSE:CC) tend to be popular with investors, and for good reason - some research suggests a significant amount of all stock market returns come from reinvested dividends. On the other hand, investors have been known to buy a stock because of its yield, and then lose money if the company's dividend doesn't live up to expectations.
In this case, Chemours likely looks attractive to dividend investors, given its 5.7% dividend yield and four-year payment history. We'd agree the yield does look enticing. The company also bought back stock during the year, equivalent to approximately 16% of the company's market capitalisation at the time. When buying stocks for their dividends, you should always run through the checks below, to see if the dividend looks sustainable.
Click the interactive chart for our full dividend analysis
Payout ratios
Companies (usually) pay dividends out of their earnings. If a company is paying more than it earns, the dividend might have to be cut. So we need to form a view on if a company's dividend is sustainable, relative to its net profit after tax. Looking at the data, we can see that 41% of Chemours's profits were paid out as dividends in the last 12 months. This is a middling range that strikes a nice balance between paying dividends to shareholders, and retaining enough earnings to invest in future growth. One of the risks is that management reinvests the retained capital poorly instead of paying a higher dividend.
In addition to comparing dividends against profits, we should inspect whether the company generated enough cash to pay its dividend. Unfortunately, while Chemours pays a dividend, it also reported negative free cash flow last year. While there may be a good reason for this, it's not ideal from a dividend perspective.
Is Chemours's Balance Sheet Risky?
As Chemours has a meaningful amount of debt, we need to check its balance sheet to see if the company might have debt risks. A quick check of its financial situation can be done with two ratios: net debt divided by EBITDA (earnings before interest, tax, depreciation and amortisation), and net interest cover. Net debt to EBITDA measures total debt load relative to company earnings (lower = less debt), while net interest cover measures the ability to pay interest on the debt (higher = greater ability to pay interest costs). Chemours is carrying net debt of 3.72 times its EBITDA, which is getting towards the upper limit of our comfort range on a dividend stock that the investor hopes will endure a wide range of economic circumstances.
Net interest cover can be calculated by dividing earnings before interest and tax (EBIT) by the company's net interest expense. Interest cover of 3.02 times its interest expense is starting to become a concern for Chemours, and be aware that lenders may place additional restrictions on the company as well.
We update our data on Chemours every 24 hours, so you can always get our latest analysis of its financial health, here.
Dividend Volatility
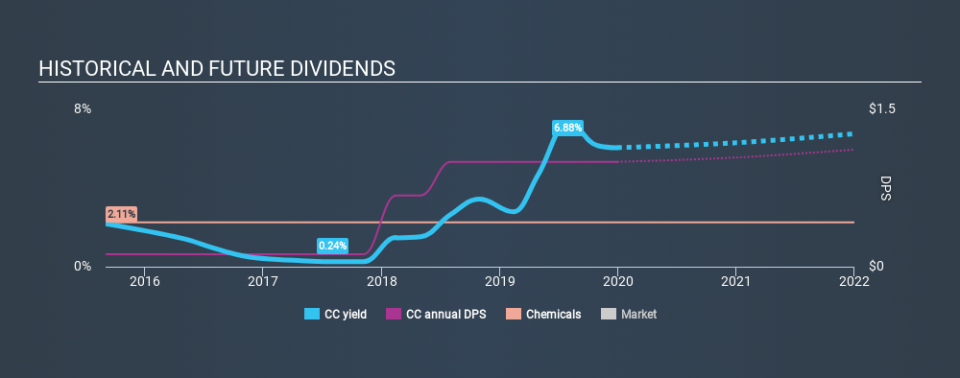
One of the major risks of relying on dividend income, is the potential for a company to struggle financially and cut its dividend. Not only is your income cut, but the value of your investment declines as well - nasty. Chemours has been paying a dividend for the past four years. The dividend has not fluctuated much, but with a relatively short payment history, we can't be sure this is sustainable across a full market cycle. During the past four-year period, the first annual payment was US$0.12 in 2015, compared to US$1.00 last year. This works out to be a compound annual growth rate (CAGR) of approximately 70% a year over that time.
Chemours has been growing its dividend quite rapidly, which is exciting. However, the short payment history makes us question whether this performance will persist across a full market cycle.
Dividend Growth Potential
While dividend payments have been relatively reliable, it would also be nice if earnings per share (EPS) were growing, as this is essential to maintaining the dividend's purchasing power over the long term. While there may be fluctuations in the past , Chemours's earnings per share have basically not grown from where they were five years ago. Flat earnings per share are acceptable for a time, but over the long term, the purchasing power of the company's dividends could be eroded by inflation. A payout ratio below 50% leaves ample room to reinvest in the business, and provides finanical flexibility. However, earnings per share are unfortunately not growing much. Might this suggest that the company should pay a higher dividend instead?
Conclusion
When we look at a dividend stock, we need to form a judgement on whether the dividend will grow, if the company is able to maintain it in a wide range of economic circumstances, and if the dividend payout is sustainable. Firstly, the company has a conservative payout ratio, although we'd note that its cashflow in the past year was substantially lower than its reported profit. Unfortunately, there hasn't been any earnings growth, and the company's dividend history is shorter than the 10 years we ideally like to see before making a strong judgement. Ultimately, Chemours comes up short on our dividend analysis. It's not that we think it is a bad company - just that there are likely more appealing dividend prospects out there on this analysis.
Earnings growth generally bodes well for the future value of company dividend payments. See if the 11 Chemours analysts we track are forecasting continued growth with our free report on analyst estimates for the company.
Looking for more high-yielding dividend ideas? Try our curated list of dividend stocks with a yield above 3%.
If you spot an error that warrants correction, please contact the editor at editorial-team@simplywallst.com. This article by Simply Wall St is general in nature. It does not constitute a recommendation to buy or sell any stock, and does not take account of your objectives, or your financial situation. Simply Wall St has no position in the stocks mentioned.
We aim to bring you long-term focused research analysis driven by fundamental data. Note that our analysis may not factor in the latest price-sensitive company announcements or qualitative material. Thank you for reading.
