Here's What Métropole Télévision S.A.'s (EPA:MMT) P/E Ratio Is Telling Us

The goal of this article is to teach you how to use price to earnings ratios (P/E ratios). We'll show how you can use Métropole Télévision S.A.'s (EPA:MMT) P/E ratio to inform your assessment of the investment opportunity. Métropole Télévision has a P/E ratio of 11.57, based on the last twelve months. That corresponds to an earnings yield of approximately 8.6%.
Check out our latest analysis for Métropole Télévision
How Do I Calculate A Price To Earnings Ratio?
The formula for P/E is:
Price to Earnings Ratio = Share Price ÷ Earnings per Share (EPS)
Or for Métropole Télévision:
P/E of 11.57 = €15.79 ÷ €1.36 (Based on the year to June 2019.)
Is A High P/E Ratio Good?
A higher P/E ratio means that investors are paying a higher price for each €1 of company earnings. All else being equal, it's better to pay a low price -- but as Warren Buffett said, 'It's far better to buy a wonderful company at a fair price than a fair company at a wonderful price.
Does Métropole Télévision Have A Relatively High Or Low P/E For Its Industry?
The P/E ratio essentially measures market expectations of a company. If you look at the image below, you can see Métropole Télévision has a lower P/E than the average (13.6) in the media industry classification.
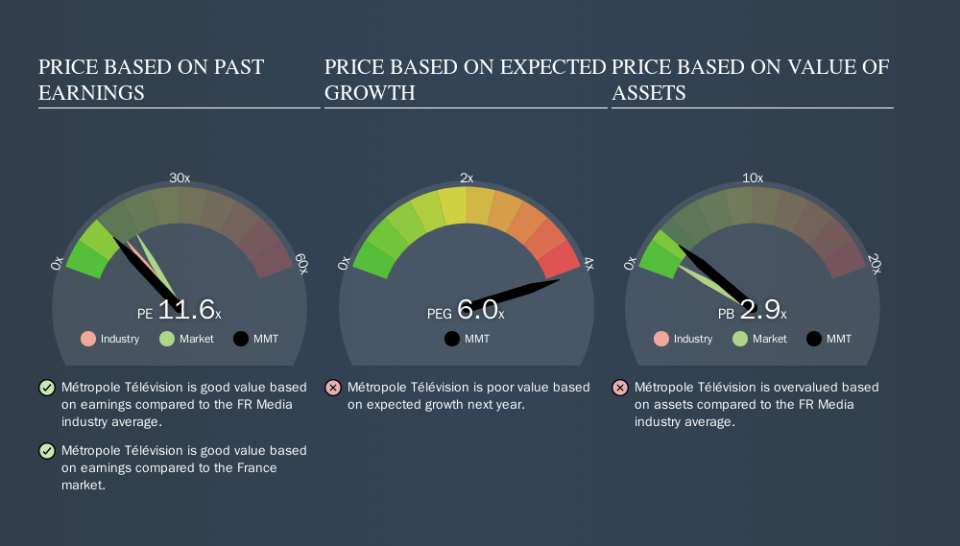
Its relatively low P/E ratio indicates that Métropole Télévision shareholders think it will struggle to do as well as other companies in its industry classification. Since the market seems unimpressed with Métropole Télévision, it's quite possible it could surprise on the upside. If you consider the stock interesting, further research is recommended. For example, I often monitor director buying and selling.
How Growth Rates Impact P/E Ratios
P/E ratios primarily reflect market expectations around earnings growth rates. If earnings are growing quickly, then the 'E' in the equation will increase faster than it would otherwise. That means unless the share price increases, the P/E will reduce in a few years. Then, a lower P/E should attract more buyers, pushing the share price up.
Métropole Télévision's earnings per share fell by 6.7% in the last twelve months. But it has grown its earnings per share by 7.4% per year over the last five years.
Remember: P/E Ratios Don't Consider The Balance Sheet
It's important to note that the P/E ratio considers the market capitalization, not the enterprise value. That means it doesn't take debt or cash into account. The exact same company would hypothetically deserve a higher P/E ratio if it had a strong balance sheet, than if it had a weak one with lots of debt, because a cashed up company can spend on growth.
While growth expenditure doesn't always pay off, the point is that it is a good option to have; but one that the P/E ratio ignores.
Is Debt Impacting Métropole Télévision's P/E?
The extra options and safety that comes with Métropole Télévision's €32m net cash position means that it deserves a higher P/E than it would if it had a lot of net debt.
The Verdict On Métropole Télévision's P/E Ratio
Métropole Télévision has a P/E of 11.6. That's below the average in the FR market, which is 17.1. Falling earnings per share are likely to be keeping potential buyers away, the healthy balance sheet means the company retains potential for future growth. If that occurs, the current low P/E could prove to be temporary.
Investors have an opportunity when market expectations about a stock are wrong. If it is underestimating a company, investors can make money by buying and holding the shares until the market corrects itself. So this free visual report on analyst forecasts could hold the key to an excellent investment decision.
Of course, you might find a fantastic investment by looking at a few good candidates. So take a peek at this free list of companies with modest (or no) debt, trading on a P/E below 20.
We aim to bring you long-term focused research analysis driven by fundamental data. Note that our analysis may not factor in the latest price-sensitive company announcements or qualitative material.
If you spot an error that warrants correction, please contact the editor at editorial-team@simplywallst.com. This article by Simply Wall St is general in nature. It does not constitute a recommendation to buy or sell any stock, and does not take account of your objectives, or your financial situation. Simply Wall St has no position in the stocks mentioned. Thank you for reading.
