Here's What Metallurgical Corporation of China Ltd.'s (HKG:1618) P/E Ratio Is Telling Us

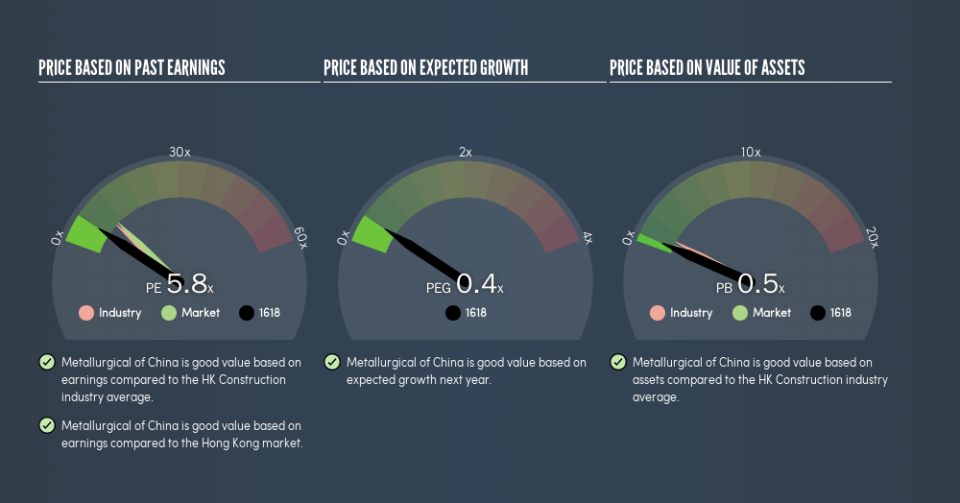
This article is written for those who want to get better at using price to earnings ratios (P/E ratios). We'll look at Metallurgical Corporation of China Ltd.'s (HKG:1618) P/E ratio and reflect on what it tells us about the company's share price. Metallurgical of China has a price to earnings ratio of 5.84, based on the last twelve months. That corresponds to an earnings yield of approximately 17%.
View our latest analysis for Metallurgical of China
How Do You Calculate Metallurgical of China's P/E Ratio?
The formula for P/E is:
Price to Earnings Ratio = Price per Share (in the reporting currency) ÷ Earnings per Share (EPS)
Or for Metallurgical of China:
P/E of 5.84 = CN¥1.61 (Note: this is the share price in the reporting currency, namely, CNY ) ÷ CN¥0.28 (Based on the year to June 2019.)
Is A High Price-to-Earnings Ratio Good?
The higher the P/E ratio, the higher the price tag of a business, relative to its trailing earnings. That is not a good or a bad thing per se, but a high P/E does imply buyers are optimistic about the future.
How Does Metallurgical of China's P/E Ratio Compare To Its Peers?
The P/E ratio essentially measures market expectations of a company. We can see in the image below that the average P/E (9.5) for companies in the construction industry is higher than Metallurgical of China's P/E.
This suggests that market participants think Metallurgical of China will underperform other companies in its industry. While current expectations are low, the stock could be undervalued if the situation is better than the market assumes. You should delve deeper. I like to check if company insiders have been buying or selling.
How Growth Rates Impact P/E Ratios
P/E ratios primarily reflect market expectations around earnings growth rates. If earnings are growing quickly, then the 'E' in the equation will increase faster than it would otherwise. And in that case, the P/E ratio itself will drop rather quickly. Then, a lower P/E should attract more buyers, pushing the share price up.
Metallurgical of China's earnings per share grew by -2.6% in the last twelve months. And it has bolstered its earnings per share by 9.7% per year over the last five years.
Don't Forget: The P/E Does Not Account For Debt or Bank Deposits
The 'Price' in P/E reflects the market capitalization of the company. Thus, the metric does not reflect cash or debt held by the company. In theory, a company can lower its future P/E ratio by using cash or debt to invest in growth.
Such expenditure might be good or bad, in the long term, but the point here is that the balance sheet is not reflected by this ratio.
Metallurgical of China's Balance Sheet
Metallurgical of China has net debt worth 73% of its market capitalization. This is enough debt that you'd have to make some adjustments before using the P/E ratio to compare it to a company with net cash.
The Bottom Line On Metallurgical of China's P/E Ratio
Metallurgical of China has a P/E of 5.8. That's below the average in the HK market, which is 10.3. It's good to see EPS growth in the last 12 months, but the debt on the balance sheet might be muting expectations.
Investors should be looking to buy stocks that the market is wrong about. As value investor Benjamin Graham famously said, 'In the short run, the market is a voting machine but in the long run, it is a weighing machine.' So this free visual report on analyst forecasts could hold the key to an excellent investment decision.
Of course, you might find a fantastic investment by looking at a few good candidates. So take a peek at this free list of companies with modest (or no) debt, trading on a P/E below 20.
We aim to bring you long-term focused research analysis driven by fundamental data. Note that our analysis may not factor in the latest price-sensitive company announcements or qualitative material.
If you spot an error that warrants correction, please contact the editor at editorial-team@simplywallst.com. This article by Simply Wall St is general in nature. It does not constitute a recommendation to buy or sell any stock, and does not take account of your objectives, or your financial situation. Simply Wall St has no position in the stocks mentioned. Thank you for reading.
