Here's How P/E Ratios Can Help Us Understand Brand Architekts Group plc (LON:BAR)

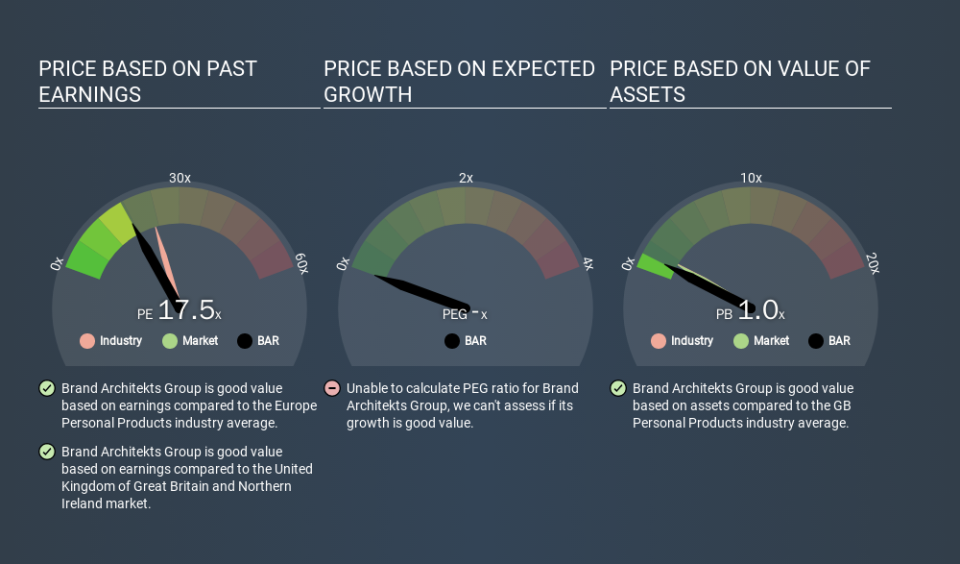
The goal of this article is to teach you how to use price to earnings ratios (P/E ratios). To keep it practical, we'll show how Brand Architekts Group plc's (LON:BAR) P/E ratio could help you assess the value on offer. Brand Architekts Group has a P/E ratio of 17.55, based on the last twelve months. That corresponds to an earnings yield of approximately 5.7%.
View our latest analysis for Brand Architekts Group
How Do I Calculate A Price To Earnings Ratio?
The formula for P/E is:
Price to Earnings Ratio = Share Price ÷ Earnings per Share (EPS)
Or for Brand Architekts Group:
P/E of 17.55 = £1.52 ÷ £0.09 (Based on the year to June 2019.)
Is A High P/E Ratio Good?
A higher P/E ratio means that investors are paying a higher price for each £1 of company earnings. That isn't necessarily good or bad, but a high P/E implies relatively high expectations of what a company can achieve in the future.
How Does Brand Architekts Group's P/E Ratio Compare To Its Peers?
We can get an indication of market expectations by looking at the P/E ratio. If you look at the image below, you can see Brand Architekts Group has a lower P/E than the average (22.9) in the personal products industry classification.
Brand Architekts Group's P/E tells us that market participants think it will not fare as well as its peers in the same industry. Many investors like to buy stocks when the market is pessimistic about their prospects. You should delve deeper. I like to check if company insiders have been buying or selling.
How Growth Rates Impact P/E Ratios
When earnings fall, the 'E' decreases, over time. That means unless the share price falls, the P/E will increase in a few years. Then, a higher P/E might scare off shareholders, pushing the share price down.
Brand Architekts Group saw earnings per share decrease by 21% last year. But it has grown its earnings per share by 44% per year over the last five years. And over the longer term (3 years) earnings per share have decreased 21% annually. This growth rate might warrant a low P/E ratio.
Remember: P/E Ratios Don't Consider The Balance Sheet
Don't forget that the P/E ratio considers market capitalization. So it won't reflect the advantage of cash, or disadvantage of debt. The exact same company would hypothetically deserve a higher P/E ratio if it had a strong balance sheet, than if it had a weak one with lots of debt, because a cashed up company can spend on growth.
Such expenditure might be good or bad, in the long term, but the point here is that the balance sheet is not reflected by this ratio.
Is Debt Impacting Brand Architekts Group's P/E?
Net debt is 27% of Brand Architekts Group's market cap. While that's enough to warrant consideration, it doesn't really concern us.
The Verdict On Brand Architekts Group's P/E Ratio
Brand Architekts Group has a P/E of 17.5. That's around the same as the average in the GB market, which is 17.6. When you consider the lack of EPS growth last year (along with some debt), it seems the market is optimistic about the future for the business.
Investors have an opportunity when market expectations about a stock are wrong. As value investor Benjamin Graham famously said, 'In the short run, the market is a voting machine but in the long run, it is a weighing machine. So this free visualization of the analyst consensus on future earnings could help you make the right decision about whether to buy, sell, or hold.
You might be able to find a better buy than Brand Architekts Group. If you want a selection of possible winners, check out this free list of interesting companies that trade on a P/E below 20 (but have proven they can grow earnings).
If you spot an error that warrants correction, please contact the editor at editorial-team@simplywallst.com. This article by Simply Wall St is general in nature. It does not constitute a recommendation to buy or sell any stock, and does not take account of your objectives, or your financial situation. Simply Wall St has no position in the stocks mentioned.
We aim to bring you long-term focused research analysis driven by fundamental data. Note that our analysis may not factor in the latest price-sensitive company announcements or qualitative material. Thank you for reading.
