Here's How P/E Ratios Can Help Us Understand Cognizant Technology Solutions Corporation (NASDAQ:CTSH)

Today, we'll introduce the concept of the P/E ratio for those who are learning about investing. To keep it practical, we'll show how Cognizant Technology Solutions Corporation's (NASDAQ:CTSH) P/E ratio could help you assess the value on offer. Based on the last twelve months, Cognizant Technology Solutions's P/E ratio is 16.77. That means that at current prices, buyers pay $16.77 for every $1 in trailing yearly profits.
Want to participate in a short research study? Help shape the future of investing tools and you could win a $250 gift card!
Check out our latest analysis for Cognizant Technology Solutions
How Do You Calculate Cognizant Technology Solutions's P/E Ratio?
The formula for P/E is:
Price to Earnings Ratio = Share Price ÷ Earnings per Share (EPS)
Or for Cognizant Technology Solutions:
P/E of 16.77 = $58.6 ÷ $3.5 (Based on the trailing twelve months to March 2019.)
Is A High P/E Ratio Good?
A higher P/E ratio implies that investors pay a higher price for the earning power of the business. That is not a good or a bad thing per se, but a high P/E does imply buyers are optimistic about the future.
How Growth Rates Impact P/E Ratios
P/E ratios primarily reflect market expectations around earnings growth rates. When earnings grow, the 'E' increases, over time. Therefore, even if you pay a high multiple of earnings now, that multiple will become lower in the future. Then, a lower P/E should attract more buyers, pushing the share price up.
It's nice to see that Cognizant Technology Solutions grew EPS by a stonking 40% in the last year. And earnings per share have improved by 10% annually, over the last five years. I'd therefore be a little surprised if its P/E ratio was not relatively high.
How Does Cognizant Technology Solutions's P/E Ratio Compare To Its Peers?
We can get an indication of market expectations by looking at the P/E ratio. If you look at the image below, you can see Cognizant Technology Solutions has a lower P/E than the average (30.8) in the it industry classification.
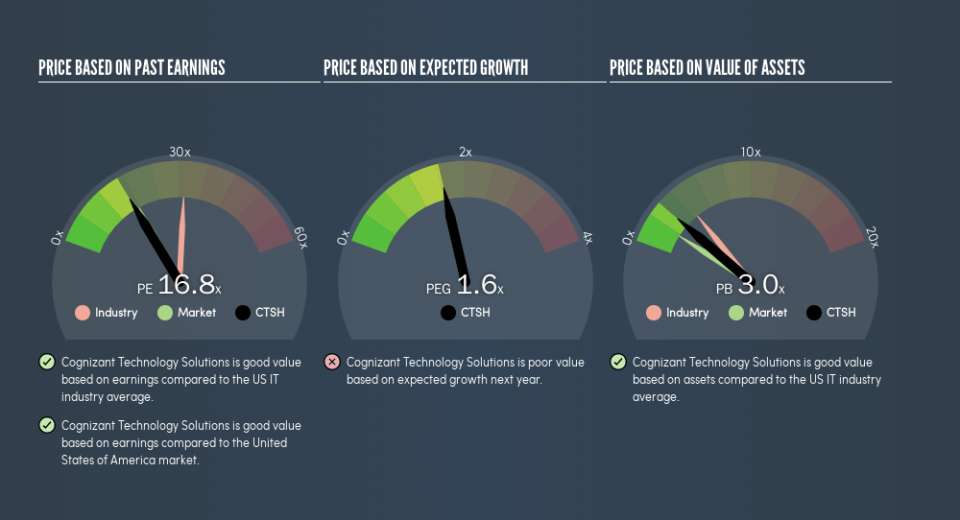
Cognizant Technology Solutions's P/E tells us that market participants think it will not fare as well as its peers in the same industry. Many investors like to buy stocks when the market is pessimistic about their prospects. You should delve deeper. I like to check if company insiders have been buying or selling.
Don't Forget: The P/E Does Not Account For Debt or Bank Deposits
It's important to note that the P/E ratio considers the market capitalization, not the enterprise value. So it won't reflect the advantage of cash, or disadvantage of debt. In theory, a company can lower its future P/E ratio by using cash or debt to invest in growth.
While growth expenditure doesn't always pay off, the point is that it is a good option to have; but one that the P/E ratio ignores.
So What Does Cognizant Technology Solutions's Balance Sheet Tell Us?
Cognizant Technology Solutions has net cash of US$2.1b. That should lead to a higher P/E than if it did have debt, because its strong balance sheets gives it more options.
The Bottom Line On Cognizant Technology Solutions's P/E Ratio
Cognizant Technology Solutions has a P/E of 16.8. That's around the same as the average in the US market, which is 17.9. The excess cash it carries is the gravy on top its fast EPS growth. So at a glance we're a bit surprised that Cognizant Technology Solutions does not have a higher P/E ratio.
Investors have an opportunity when market expectations about a stock are wrong. If the reality for a company is not as bad as the P/E ratio indicates, then the share price should increase as the market realizes this. So this free visual report on analyst forecasts could hold the key to an excellent investment decision.
But note: Cognizant Technology Solutions may not be the best stock to buy. So take a peek at this free list of interesting companies with strong recent earnings growth (and a P/E ratio below 20).
We aim to bring you long-term focused research analysis driven by fundamental data. Note that our analysis may not factor in the latest price-sensitive company announcements or qualitative material.
If you spot an error that warrants correction, please contact the editor at editorial-team@simplywallst.com. This article by Simply Wall St is general in nature. It does not constitute a recommendation to buy or sell any stock, and does not take account of your objectives, or your financial situation. Simply Wall St has no position in the stocks mentioned. Thank you for reading.
