Here's How P/E Ratios Can Help Us Understand First Midwest Bancorp, Inc. (NASDAQ:FMBI)

Today, we'll introduce the concept of the P/E ratio for those who are learning about investing. We'll show how you can use First Midwest Bancorp, Inc.'s (NASDAQ:FMBI) P/E ratio to inform your assessment of the investment opportunity. Looking at earnings over the last twelve months, First Midwest Bancorp has a P/E ratio of 12.17. That is equivalent to an earnings yield of about 8.2%.
See our latest analysis for First Midwest Bancorp
How Do I Calculate A Price To Earnings Ratio?
The formula for P/E is:
Price to Earnings Ratio = Share Price ÷ Earnings per Share (EPS)
Or for First Midwest Bancorp:
P/E of 12.17 = $21.29 ÷ $1.75 (Based on the year to September 2019.)
Is A High Price-to-Earnings Ratio Good?
The higher the P/E ratio, the higher the price tag of a business, relative to its trailing earnings. All else being equal, it's better to pay a low price -- but as Warren Buffett said, 'It's far better to buy a wonderful company at a fair price than a fair company at a wonderful price.
Does First Midwest Bancorp Have A Relatively High Or Low P/E For Its Industry?
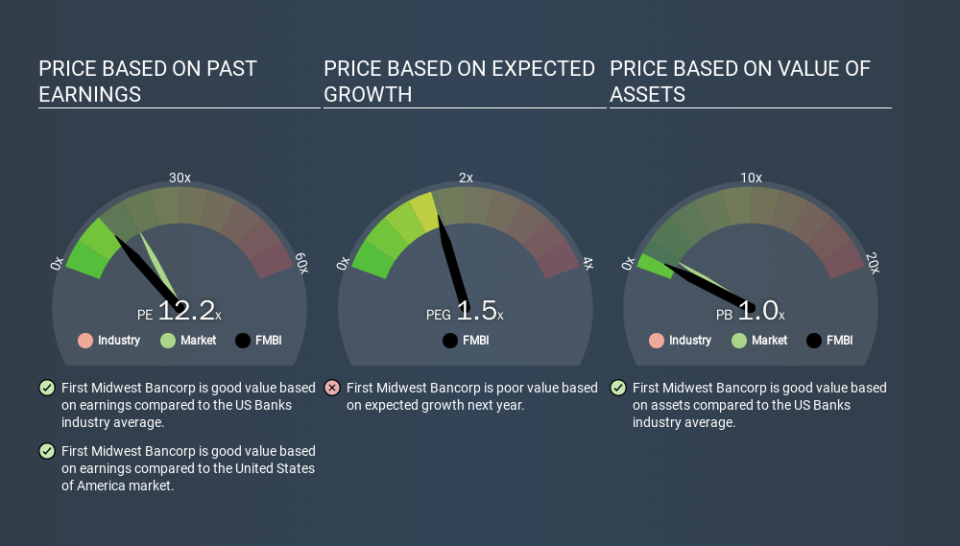
We can get an indication of market expectations by looking at the P/E ratio. You can see in the image below that the average P/E (12.6) for companies in the banks industry is roughly the same as First Midwest Bancorp's P/E.
Its P/E ratio suggests that First Midwest Bancorp shareholders think that in the future it will perform about the same as other companies in its industry classification. So if First Midwest Bancorp actually outperforms its peers going forward, that should be a positive for the share price. I would further inform my view by checking insider buying and selling., among other things.
How Growth Rates Impact P/E Ratios
Probably the most important factor in determining what P/E a company trades on is the earnings growth. When earnings grow, the 'E' increases, over time. Therefore, even if you pay a high multiple of earnings now, that multiple will become lower in the future. And as that P/E ratio drops, the company will look cheap, unless its share price increases.
First Midwest Bancorp's 51% EPS improvement over the last year was like bamboo growth after rain; rapid and impressive. Even better, EPS is up 17% per year over three years. So we'd absolutely expect it to have a relatively high P/E ratio.
A Limitation: P/E Ratios Ignore Debt and Cash In The Bank
Don't forget that the P/E ratio considers market capitalization. In other words, it does not consider any debt or cash that the company may have on the balance sheet. The exact same company would hypothetically deserve a higher P/E ratio if it had a strong balance sheet, than if it had a weak one with lots of debt, because a cashed up company can spend on growth.
Spending on growth might be good or bad a few years later, but the point is that the P/E ratio does not account for the option (or lack thereof).
Is Debt Impacting First Midwest Bancorp's P/E?
First Midwest Bancorp has net debt worth 58% of its market capitalization. If you want to compare its P/E ratio to other companies, you should absolutely keep in mind it has significant borrowings.
The Bottom Line On First Midwest Bancorp's P/E Ratio
First Midwest Bancorp has a P/E of 12.2. That's below the average in the US market, which is 18.1. The company may have significant debt, but EPS growth was good last year. If it continues to grow, then the current low P/E may prove to be unjustified.
Investors should be looking to buy stocks that the market is wrong about. As value investor Benjamin Graham famously said, 'In the short run, the market is a voting machine but in the long run, it is a weighing machine. So this free visualization of the analyst consensus on future earnings could help you make the right decision about whether to buy, sell, or hold.
But note: First Midwest Bancorp may not be the best stock to buy. So take a peek at this free list of interesting companies with strong recent earnings growth (and a P/E ratio below 20).
If you spot an error that warrants correction, please contact the editor at editorial-team@simplywallst.com. This article by Simply Wall St is general in nature. It does not constitute a recommendation to buy or sell any stock, and does not take account of your objectives, or your financial situation. Simply Wall St has no position in the stocks mentioned.
We aim to bring you long-term focused research analysis driven by fundamental data. Note that our analysis may not factor in the latest price-sensitive company announcements or qualitative material. Thank you for reading.
