Here's How P/E Ratios Can Help Us Understand M&T Bank Corporation (NYSE:MTB)

Want to participate in a short research study? Help shape the future of investing tools and you could win a $250 gift card!
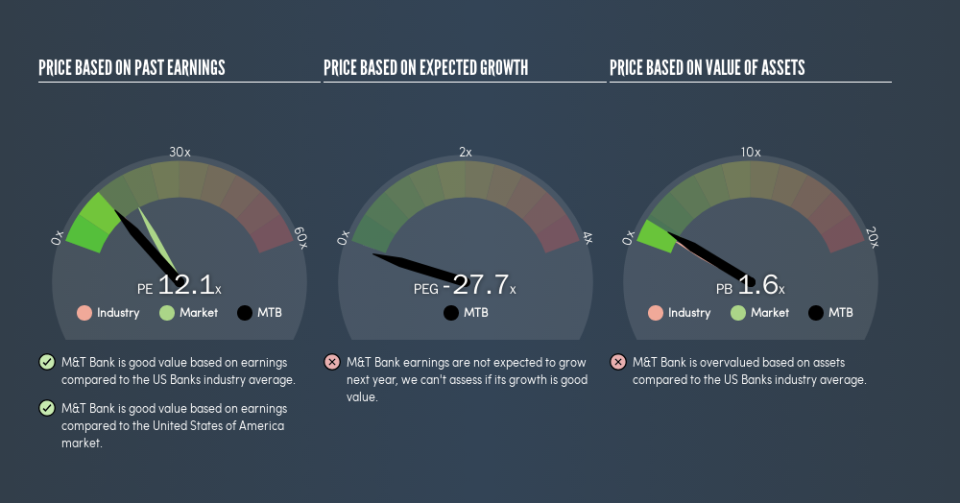
This article is for investors who would like to improve their understanding of price to earnings ratios (P/E ratios). We'll show how you can use M&T Bank Corporation's (NYSE:MTB) P/E ratio to inform your assessment of the investment opportunity. Based on the last twelve months, M&T Bank's P/E ratio is 12.07. In other words, at today's prices, investors are paying $12.07 for every $1 in prior year profit.
Check out our latest analysis for M&T Bank
How Do I Calculate M&T Bank's Price To Earnings Ratio?
The formula for price to earnings is:
Price to Earnings Ratio = Share Price ÷ Earnings per Share (EPS)
Or for M&T Bank:
P/E of 12.07 = $167.9 ÷ $13.91 (Based on the year to March 2019.)
Is A High Price-to-Earnings Ratio Good?
A higher P/E ratio implies that investors pay a higher price for the earning power of the business. All else being equal, it's better to pay a low price -- but as Warren Buffett said, 'It's far better to buy a wonderful company at a fair price than a fair company at a wonderful price.'
How Growth Rates Impact P/E Ratios
P/E ratios primarily reflect market expectations around earnings growth rates. Earnings growth means that in the future the 'E' will be higher. That means unless the share price increases, the P/E will reduce in a few years. A lower P/E should indicate the stock is cheap relative to others -- and that may attract buyers.
In the last year, M&T Bank grew EPS like Taylor Swift grew her fan base back in 2010; the 57% gain was both fast and well deserved. And earnings per share have improved by 24% annually, over the last three years. So we'd absolutely expect it to have a relatively high P/E ratio.
How Does M&T Bank's P/E Ratio Compare To Its Peers?
The P/E ratio indicates whether the market has higher or lower expectations of a company. You can see in the image below that the average P/E (12.7) for companies in the banks industry is roughly the same as M&T Bank's P/E.
Its P/E ratio suggests that M&T Bank shareholders think that in the future it will perform about the same as other companies in its industry classification. So if M&T Bank actually outperforms its peers going forward, that should be a positive for the share price. Further research into factors such asmanagement tenure, could help you form your own view on whether that is likely.
A Limitation: P/E Ratios Ignore Debt and Cash In The Bank
One drawback of using a P/E ratio is that it considers market capitalization, but not the balance sheet. Thus, the metric does not reflect cash or debt held by the company. In theory, a company can lower its future P/E ratio by using cash or debt to invest in growth.
While growth expenditure doesn't always pay off, the point is that it is a good option to have; but one that the P/E ratio ignores.
So What Does M&T Bank's Balance Sheet Tell Us?
Net debt totals 13% of M&T Bank's market cap. That's enough debt to impact the P/E ratio a little; so keep it in mind if you're comparing it to companies without debt.
The Bottom Line On M&T Bank's P/E Ratio
M&T Bank trades on a P/E ratio of 12.1, which is below the US market average of 17.7. The company does have a little debt, and EPS growth was good last year. If the company can continue to grow earnings, then the current P/E may be unjustifiably low.
When the market is wrong about a stock, it gives savvy investors an opportunity. As value investor Benjamin Graham famously said, 'In the short run, the market is a voting machine but in the long run, it is a weighing machine.' So this free report on the analyst consensus forecasts could help you make a master move on this stock.
But note: M&T Bank may not be the best stock to buy. So take a peek at this free list of interesting companies with strong recent earnings growth (and a P/E ratio below 20).
We aim to bring you long-term focused research analysis driven by fundamental data. Note that our analysis may not factor in the latest price-sensitive company announcements or qualitative material.
If you spot an error that warrants correction, please contact the editor at editorial-team@simplywallst.com. This article by Simply Wall St is general in nature. It does not constitute a recommendation to buy or sell any stock, and does not take account of your objectives, or your financial situation. Simply Wall St has no position in the stocks mentioned. Thank you for reading.
