Here's What RF Industries, Ltd.'s (NASDAQ:RFIL) P/E Ratio Is Telling Us

Want to participate in a short research study? Help shape the future of investing tools and you could win a $250 gift card!
This article is written for those who want to get better at using price to earnings ratios (P/E ratios). We'll show how you can use RF Industries, Ltd.'s (NASDAQ:RFIL) P/E ratio to inform your assessment of the investment opportunity. RF Industries has a P/E ratio of 17.47, based on the last twelve months. That means that at current prices, buyers pay $17.47 for every $1 in trailing yearly profits.
See our latest analysis for RF Industries
How Do I Calculate A Price To Earnings Ratio?
The formula for price to earnings is:
Price to Earnings Ratio = Share Price ÷ Earnings per Share (EPS)
Or for RF Industries:
P/E of 17.47 = $8.01 ÷ $0.46 (Based on the year to April 2019.)
Is A High Price-to-Earnings Ratio Good?
A higher P/E ratio means that investors are paying a higher price for each $1 of company earnings. All else being equal, it's better to pay a low price -- but as Warren Buffett said, 'It's far better to buy a wonderful company at a fair price than a fair company at a wonderful price.'
How Growth Rates Impact P/E Ratios
Generally speaking the rate of earnings growth has a profound impact on a company's P/E multiple. When earnings grow, the 'E' increases, over time. That means unless the share price increases, the P/E will reduce in a few years. So while a stock may look expensive based on past earnings, it could be cheap based on future earnings.
RF Industries saw earnings per share improve by -6.0% last year. And it has bolstered its earnings per share by 6.2% per year over the last five years.
Does RF Industries Have A Relatively High Or Low P/E For Its Industry?
The P/E ratio indicates whether the market has higher or lower expectations of a company. As you can see below RF Industries has a P/E ratio that is fairly close for the average for the electronic industry, which is 17.9.
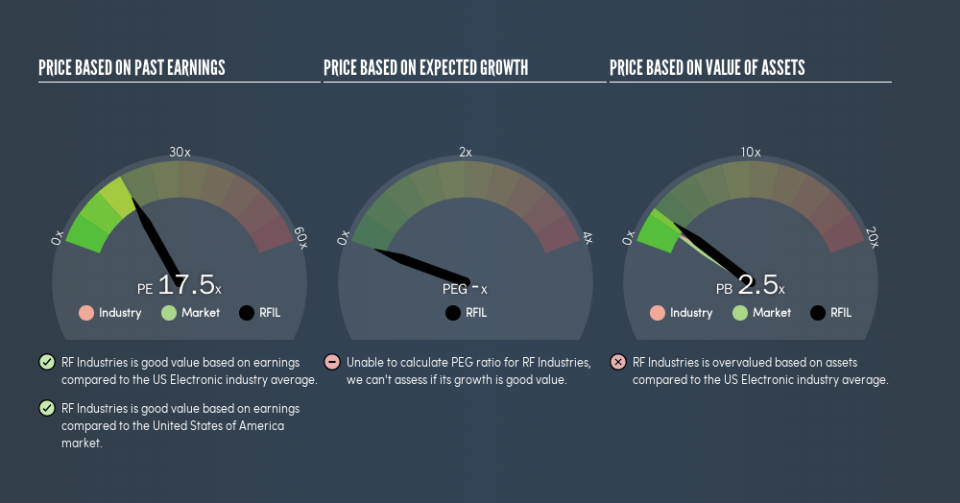
That indicates that the market expects RF Industries will perform roughly in line with other companies in its industry. If the company has better than average prospects, then the market might be underestimating it. Further research into factors such asmanagement tenure, could help you form your own view on whether that is likely.
Don't Forget: The P/E Does Not Account For Debt or Bank Deposits
One drawback of using a P/E ratio is that it considers market capitalization, but not the balance sheet. That means it doesn't take debt or cash into account. In theory, a company can lower its future P/E ratio by using cash or debt to invest in growth.
Such expenditure might be good or bad, in the long term, but the point here is that the balance sheet is not reflected by this ratio.
So What Does RF Industries's Balance Sheet Tell Us?
With net cash of US$14m, RF Industries has a very strong balance sheet, which may be important for its business. Having said that, at 18% of its market capitalization the cash hoard would contribute towards a higher P/E ratio.
The Bottom Line On RF Industries's P/E Ratio
RF Industries's P/E is 17.5 which is about average (17.7) in the US market. Recent earnings growth wasn't bad. And the healthy balance sheet means the company can sustain growth. But the P/E suggests shareholders have some doubts.
Investors have an opportunity when market expectations about a stock are wrong. As value investor Benjamin Graham famously said, 'In the short run, the market is a voting machine but in the long run, it is a weighing machine.' We don't have analyst forecasts, but shareholders might want to examine this detailed historical graph of earnings, revenue and cash flow.
Of course, you might find a fantastic investment by looking at a few good candidates. So take a peek at this free list of companies with modest (or no) debt, trading on a P/E below 20.
We aim to bring you long-term focused research analysis driven by fundamental data. Note that our analysis may not factor in the latest price-sensitive company announcements or qualitative material.
If you spot an error that warrants correction, please contact the editor at editorial-team@simplywallst.com. This article by Simply Wall St is general in nature. It does not constitute a recommendation to buy or sell any stock, and does not take account of your objectives, or your financial situation. Simply Wall St has no position in the stocks mentioned. Thank you for reading.
