Here's What Sandvik AB's (STO:SAND) P/E Ratio Is Telling Us

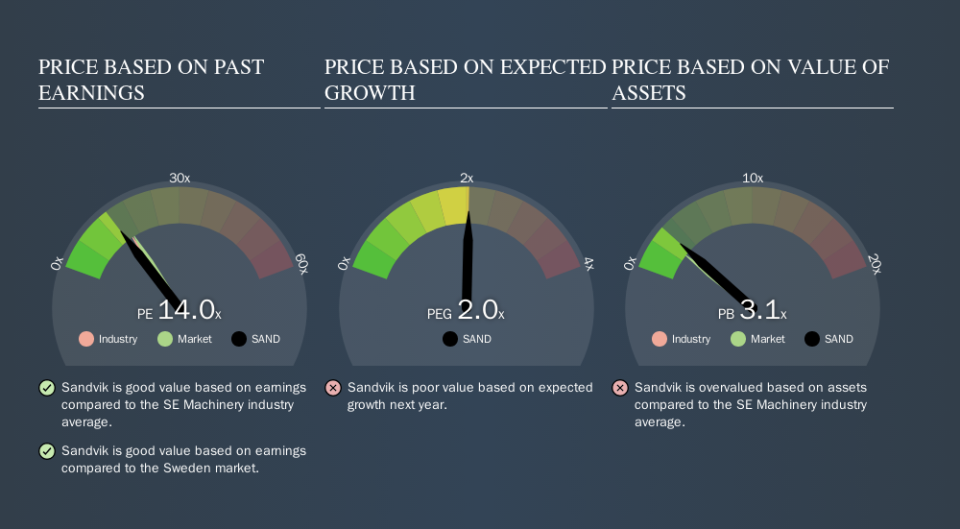
The goal of this article is to teach you how to use price to earnings ratios (P/E ratios). We'll show how you can use Sandvik AB's (STO:SAND) P/E ratio to inform your assessment of the investment opportunity. What is Sandvik's P/E ratio? Well, based on the last twelve months it is 14.01. In other words, at today's prices, investors are paying SEK14.01 for every SEK1 in prior year profit.
Check out our latest analysis for Sandvik
How Do I Calculate Sandvik's Price To Earnings Ratio?
The formula for price to earnings is:
Price to Earnings Ratio = Share Price ÷ Earnings per Share (EPS)
Or for Sandvik:
P/E of 14.01 = SEK151.15 ÷ SEK10.79 (Based on the year to June 2019.)
Is A High Price-to-Earnings Ratio Good?
A higher P/E ratio means that buyers have to pay a higher price for each SEK1 the company has earned over the last year. That is not a good or a bad thing per se, but a high P/E does imply buyers are optimistic about the future.
Does Sandvik Have A Relatively High Or Low P/E For Its Industry?
The P/E ratio essentially measures market expectations of a company. We can see in the image below that the average P/E (15.8) for companies in the machinery industry is higher than Sandvik's P/E.
Its relatively low P/E ratio indicates that Sandvik shareholders think it will struggle to do as well as other companies in its industry classification. Many investors like to buy stocks when the market is pessimistic about their prospects. It is arguably worth checking if insiders are buying shares, because that might imply they believe the stock is undervalued.
How Growth Rates Impact P/E Ratios
Earnings growth rates have a big influence on P/E ratios. That's because companies that grow earnings per share quickly will rapidly increase the 'E' in the equation. And in that case, the P/E ratio itself will drop rather quickly. And as that P/E ratio drops, the company will look cheap, unless its share price increases.
Sandvik saw earnings per share decrease by 11% last year. But over the longer term (5 years) earnings per share have increased by 24%.
Don't Forget: The P/E Does Not Account For Debt or Bank Deposits
It's important to note that the P/E ratio considers the market capitalization, not the enterprise value. In other words, it does not consider any debt or cash that the company may have on the balance sheet. The exact same company would hypothetically deserve a higher P/E ratio if it had a strong balance sheet, than if it had a weak one with lots of debt, because a cashed up company can spend on growth.
Spending on growth might be good or bad a few years later, but the point is that the P/E ratio does not account for the option (or lack thereof).
So What Does Sandvik's Balance Sheet Tell Us?
Net debt totals 10% of Sandvik's market cap. This could bring some additional risk, and reduce the number of investment options for management; worth remembering if you compare its P/E to businesses without debt.
The Verdict On Sandvik's P/E Ratio
Sandvik trades on a P/E ratio of 14, which is below the SE market average of 16.4. The debt levels are not a major concern, but the lack of EPS growth is likely weighing on sentiment.
When the market is wrong about a stock, it gives savvy investors an opportunity. If the reality for a company is not as bad as the P/E ratio indicates, then the share price should increase as the market realizes this. So this free report on the analyst consensus forecasts could help you make a master move on this stock.
You might be able to find a better buy than Sandvik. If you want a selection of possible winners, check out this free list of interesting companies that trade on a P/E below 20 (but have proven they can grow earnings).
We aim to bring you long-term focused research analysis driven by fundamental data. Note that our analysis may not factor in the latest price-sensitive company announcements or qualitative material.
If you spot an error that warrants correction, please contact the editor at editorial-team@simplywallst.com. This article by Simply Wall St is general in nature. It does not constitute a recommendation to buy or sell any stock, and does not take account of your objectives, or your financial situation. Simply Wall St has no position in the stocks mentioned. Thank you for reading.
