Here's What Siltronic AG's (ETR:WAF) P/E Ratio Is Telling Us

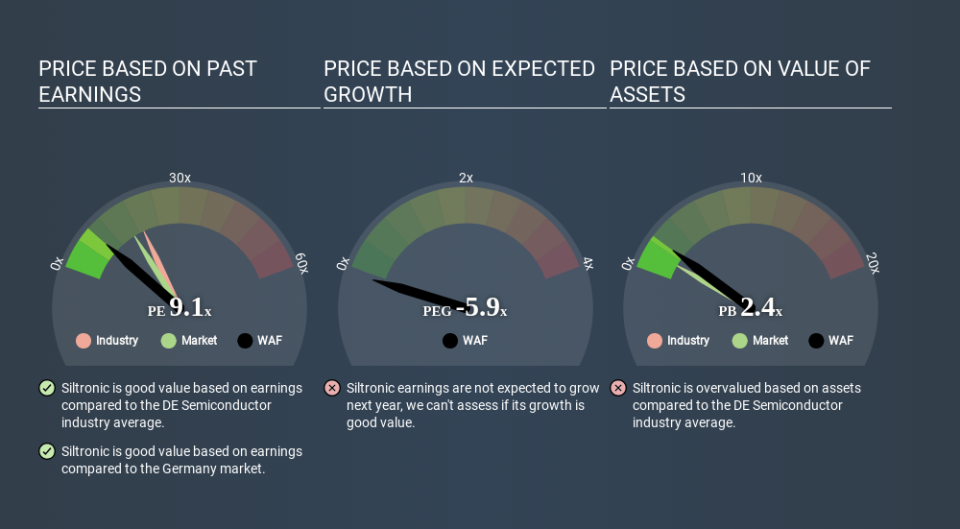
The goal of this article is to teach you how to use price to earnings ratios (P/E ratios). We'll look at Siltronic AG's (ETR:WAF) P/E ratio and reflect on what it tells us about the company's share price. What is Siltronic's P/E ratio? Well, based on the last twelve months it is 9.08. In other words, at today's prices, investors are paying €9.08 for every €1 in prior year profit.
See our latest analysis for Siltronic
How Do You Calculate A P/E Ratio?
The formula for price to earnings is:
Price to Earnings Ratio = Share Price ÷ Earnings per Share (EPS)
Or for Siltronic:
P/E of 9.08 = €68.260 ÷ €7.520 (Based on the year to December 2019.)
(Note: the above calculation results may not be precise due to rounding.)
Is A High P/E Ratio Good?
A higher P/E ratio means that investors are paying a higher price for each €1 of company earnings. That is not a good or a bad thing per se, but a high P/E does imply buyers are optimistic about the future.
Does Siltronic Have A Relatively High Or Low P/E For Its Industry?
We can get an indication of market expectations by looking at the P/E ratio. The image below shows that Siltronic has a lower P/E than the average (19.5) P/E for companies in the semiconductor industry.
Its relatively low P/E ratio indicates that Siltronic shareholders think it will struggle to do as well as other companies in its industry classification. While current expectations are low, the stock could be undervalued if the situation is better than the market assumes. You should delve deeper. I like to check if company insiders have been buying or selling.
How Growth Rates Impact P/E Ratios
Generally speaking the rate of earnings growth has a profound impact on a company's P/E multiple. If earnings are growing quickly, then the 'E' in the equation will increase faster than it would otherwise. Therefore, even if you pay a high multiple of earnings now, that multiple will become lower in the future. Then, a lower P/E should attract more buyers, pushing the share price up.
Siltronic's earnings per share fell by 40% in the last twelve months. But over the longer term (3 years), earnings per share have increased by 166%.
Remember: P/E Ratios Don't Consider The Balance Sheet
Don't forget that the P/E ratio considers market capitalization. In other words, it does not consider any debt or cash that the company may have on the balance sheet. Hypothetically, a company could reduce its future P/E ratio by spending its cash (or taking on debt) to achieve higher earnings.
Spending on growth might be good or bad a few years later, but the point is that the P/E ratio does not account for the option (or lack thereof).
How Does Siltronic's Debt Impact Its P/E Ratio?
With net cash of €539m, Siltronic has a very strong balance sheet, which may be important for its business. Having said that, at 26% of its market capitalization the cash hoard would contribute towards a higher P/E ratio.
The Verdict On Siltronic's P/E Ratio
Siltronic trades on a P/E ratio of 9.1, which is below the DE market average of 16.8. The recent drop in earnings per share would make investors cautious, the relatively strong balance sheet will allow the company time to invest in growth. If it achieves that, then there's real potential that the low P/E could eventually indicate undervaluation.
When the market is wrong about a stock, it gives savvy investors an opportunity. As value investor Benjamin Graham famously said, 'In the short run, the market is a voting machine but in the long run, it is a weighing machine. So this free report on the analyst consensus forecasts could help you make a master move on this stock.
But note: Siltronic may not be the best stock to buy. So take a peek at this free list of interesting companies with strong recent earnings growth (and a P/E ratio below 20).
If you spot an error that warrants correction, please contact the editor at editorial-team@simplywallst.com. This article by Simply Wall St is general in nature. It does not constitute a recommendation to buy or sell any stock, and does not take account of your objectives, or your financial situation. Simply Wall St has no position in the stocks mentioned.
We aim to bring you long-term focused research analysis driven by fundamental data. Note that our analysis may not factor in the latest price-sensitive company announcements or qualitative material. Thank you for reading.
