Here's What Softing AG's (ETR:SYT) P/E Ratio Is Telling Us

Today, we'll introduce the concept of the P/E ratio for those who are learning about investing. We'll look at Softing AG's (ETR:SYT) P/E ratio and reflect on what it tells us about the company's share price. Looking at earnings over the last twelve months, Softing has a P/E ratio of 20.34. That means that at current prices, buyers pay €20.34 for every €1 in trailing yearly profits.
View our latest analysis for Softing
How Do You Calculate A P/E Ratio?
The formula for price to earnings is:
Price to Earnings Ratio = Share Price ÷ Earnings per Share (EPS)
Or for Softing:
P/E of 20.34 = EUR8.08 ÷ EUR0.40 (Based on the year to September 2019.)
Is A High Price-to-Earnings Ratio Good?
A higher P/E ratio means that buyers have to pay a higher price for each EUR1 the company has earned over the last year. All else being equal, it's better to pay a low price -- but as Warren Buffett said, 'It's far better to buy a wonderful company at a fair price than a fair company at a wonderful price'.
Does Softing Have A Relatively High Or Low P/E For Its Industry?
The P/E ratio indicates whether the market has higher or lower expectations of a company. The image below shows that Softing has a lower P/E than the average (30.3) P/E for companies in the electronic industry.
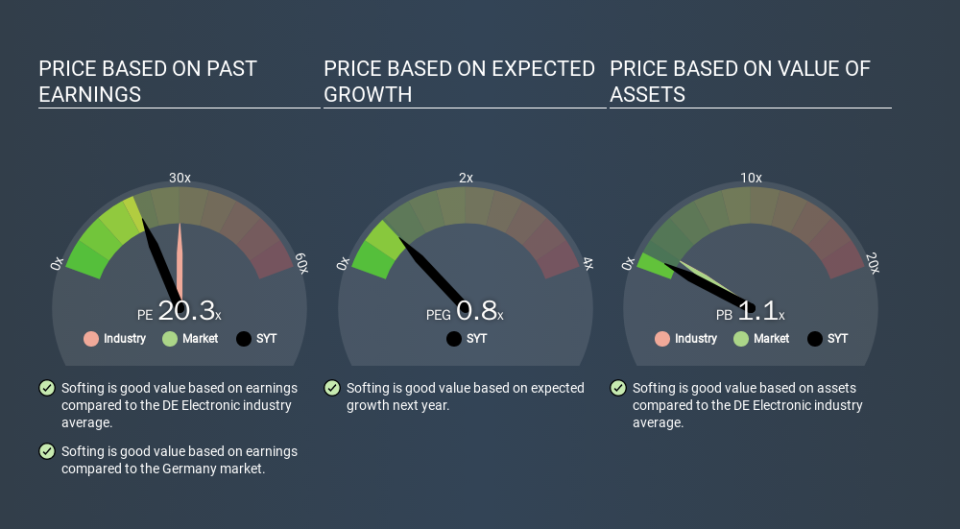
Softing's P/E tells us that market participants think it will not fare as well as its peers in the same industry. Many investors like to buy stocks when the market is pessimistic about their prospects. It is arguably worth checking if insiders are buying shares, because that might imply they believe the stock is undervalued.
How Growth Rates Impact P/E Ratios
When earnings fall, the 'E' decreases, over time. That means unless the share price falls, the P/E will increase in a few years. Then, a higher P/E might scare off shareholders, pushing the share price down.
It's nice to see that Softing grew EPS by a stonking 36% in the last year. Unfortunately, earnings per share are down 10% a year, over 5 years.
Don't Forget: The P/E Does Not Account For Debt or Bank Deposits
The 'Price' in P/E reflects the market capitalization of the company. That means it doesn't take debt or cash into account. The exact same company would hypothetically deserve a higher P/E ratio if it had a strong balance sheet, than if it had a weak one with lots of debt, because a cashed up company can spend on growth.
Spending on growth might be good or bad a few years later, but the point is that the P/E ratio does not account for the option (or lack thereof).
Is Debt Impacting Softing's P/E?
The extra options and safety that comes with Softing's €505k net cash position means that it deserves a higher P/E than it would if it had a lot of net debt.
The Verdict On Softing's P/E Ratio
Softing trades on a P/E ratio of 20.3, which is fairly close to the DE market average of 20.6. The excess cash it carries is the gravy on top its fast EPS growth. So based on this analysis we'd expect Softing to have a higher P/E ratio.
Investors have an opportunity when market expectations about a stock are wrong. As value investor Benjamin Graham famously said, 'In the short run, the market is a voting machine but in the long run, it is a weighing machine. So this free visualization of the analyst consensus on future earnings could help you make the right decision about whether to buy, sell, or hold.
Of course, you might find a fantastic investment by looking at a few good candidates. So take a peek at this free list of companies with modest (or no) debt, trading on a P/E below 20.
If you spot an error that warrants correction, please contact the editor at editorial-team@simplywallst.com. This article by Simply Wall St is general in nature. It does not constitute a recommendation to buy or sell any stock, and does not take account of your objectives, or your financial situation. Simply Wall St has no position in the stocks mentioned.
We aim to bring you long-term focused research analysis driven by fundamental data. Note that our analysis may not factor in the latest price-sensitive company announcements or qualitative material. Thank you for reading.
