Here's What T-Mobile US, Inc.'s (NASDAQ:TMUS) ROCE Can Tell Us

Today we'll look at T-Mobile US, Inc. (NASDAQ:TMUS) and reflect on its potential as an investment. In particular, we'll consider its Return On Capital Employed (ROCE), as that can give us insight into how profitably the company is able to employ capital in its business.
First, we'll go over how we calculate ROCE. Next, we'll compare it to others in its industry. And finally, we'll look at how its current liabilities are impacting its ROCE.
Understanding Return On Capital Employed (ROCE)
ROCE is a measure of a company's yearly pre-tax profit (its return), relative to the capital employed in the business. Generally speaking a higher ROCE is better. In brief, it is a useful tool, but it is not without drawbacks. Renowned investment researcher Michael Mauboussin has suggested that a high ROCE can indicate that 'one dollar invested in the company generates value of more than one dollar'.
How Do You Calculate Return On Capital Employed?
Analysts use this formula to calculate return on capital employed:
Return on Capital Employed = Earnings Before Interest and Tax (EBIT) ÷ (Total Assets - Current Liabilities)
Or for T-Mobile US:
0.084 = US$6.0b ÷ (US$85b - US$13b) (Based on the trailing twelve months to June 2019.)
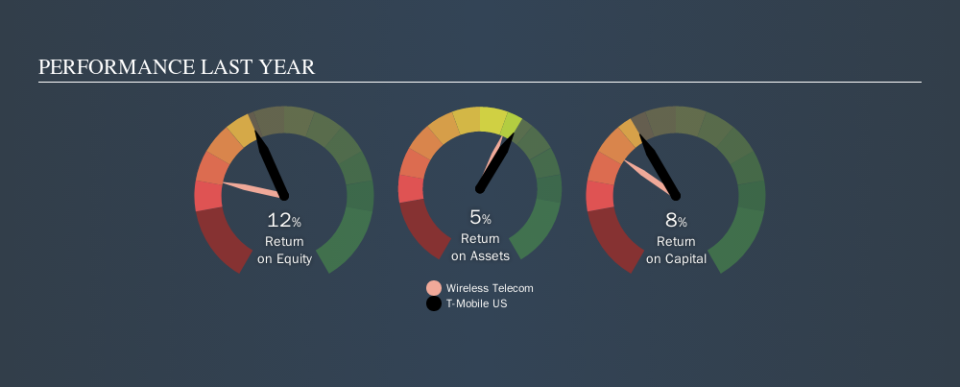
So, T-Mobile US has an ROCE of 8.4%.
Check out our latest analysis for T-Mobile US
Does T-Mobile US Have A Good ROCE?
One way to assess ROCE is to compare similar companies. T-Mobile US's ROCE appears to be substantially greater than the 6.1% average in the Wireless Telecom industry. We consider this a positive sign, because it suggests it uses capital more efficiently than similar companies. Aside from the industry comparison, T-Mobile US's ROCE is mediocre in absolute terms, considering the risk of investing in stocks versus the safety of a bank account. Readers may find more attractive investment prospects elsewhere.
We can see that, T-Mobile US currently has an ROCE of 8.4% compared to its ROCE 3 years ago, which was 5.4%. This makes us think about whether the company has been reinvesting shrewdly. You can see in the image below how T-Mobile US's ROCE compares to its industry. Click to see more on past growth.
When considering ROCE, bear in mind that it reflects the past and does not necessarily predict the future. ROCE can be deceptive for cyclical businesses, as returns can look incredible in boom times, and terribly low in downturns. ROCE is only a point-in-time measure. Since the future is so important for investors, you should check out our free report on analyst forecasts for T-Mobile US.
How T-Mobile US's Current Liabilities Impact Its ROCE
Short term (or current) liabilities, are things like supplier invoices, overdrafts, or tax bills that need to be paid within 12 months. Due to the way the ROCE equation works, having large bills due in the near term can make it look as though a company has less capital employed, and thus a higher ROCE than usual. To counter this, investors can check if a company has high current liabilities relative to total assets.
T-Mobile US has total liabilities of US$13b and total assets of US$85b. As a result, its current liabilities are equal to approximately 16% of its total assets. This very reasonable level of current liabilities would not boost the ROCE by much.
Our Take On T-Mobile US's ROCE
If T-Mobile US continues to earn an uninspiring ROCE, there may be better places to invest. But note: make sure you look for a great company, not just the first idea you come across. So take a peek at this free list of interesting companies with strong recent earnings growth (and a P/E ratio below 20).
I will like T-Mobile US better if I see some big insider buys. While we wait, check out this free list of growing companies with considerable, recent, insider buying.
We aim to bring you long-term focused research analysis driven by fundamental data. Note that our analysis may not factor in the latest price-sensitive company announcements or qualitative material.
If you spot an error that warrants correction, please contact the editor at editorial-team@simplywallst.com. This article by Simply Wall St is general in nature. It does not constitute a recommendation to buy or sell any stock, and does not take account of your objectives, or your financial situation. Simply Wall St has no position in the stocks mentioned. Thank you for reading.
