Here's What Valmont Industries, Inc.'s (NYSE:VMI) P/E Is Telling Us

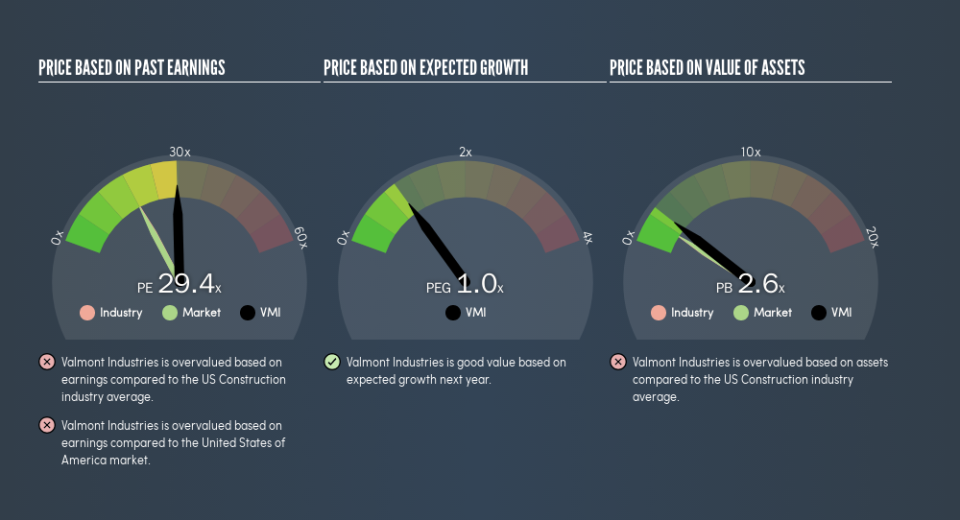
This article is for investors who would like to improve their understanding of price to earnings ratios (P/E ratios). We'll show how you can use Valmont Industries, Inc.'s (NYSE:VMI) P/E ratio to inform your assessment of the investment opportunity. Based on the last twelve months, Valmont Industries's P/E ratio is 29.4. That means that at current prices, buyers pay $29.4 for every $1 in trailing yearly profits.
See our latest analysis for Valmont Industries
How Do I Calculate A Price To Earnings Ratio?
The formula for price to earnings is:
Price to Earnings Ratio = Price per Share ÷ Earnings per Share (EPS)
Or for Valmont Industries:
P/E of 29.4 = $133.93 ÷ $4.56 (Based on the year to June 2019.)
Is A High Price-to-Earnings Ratio Good?
A higher P/E ratio means that buyers have to pay a higher price for each $1 the company has earned over the last year. That isn't necessarily good or bad, but a high P/E implies relatively high expectations of what a company can achieve in the future.
How Does Valmont Industries's P/E Ratio Compare To Its Peers?
We can get an indication of market expectations by looking at the P/E ratio. As you can see below, Valmont Industries has a higher P/E than the average company (15.4) in the construction industry.
Its relatively high P/E ratio indicates that Valmont Industries shareholders think it will perform better than other companies in its industry classification. Clearly the market expects growth, but it isn't guaranteed. So investors should delve deeper. I like to check if company insiders have been buying or selling.
How Growth Rates Impact P/E Ratios
Probably the most important factor in determining what P/E a company trades on is the earnings growth. That's because companies that grow earnings per share quickly will rapidly increase the 'E' in the equation. That means even if the current P/E is high, it will reduce over time if the share price stays flat. And as that P/E ratio drops, the company will look cheap, unless its share price increases.
Valmont Industries shrunk earnings per share by 1.3% last year. But it has grown its earnings per share by 23% per year over the last three years. And EPS is down 12% a year, over the last 5 years. So we might expect a relatively low P/E.
A Limitation: P/E Ratios Ignore Debt and Cash In The Bank
Don't forget that the P/E ratio considers market capitalization. In other words, it does not consider any debt or cash that the company may have on the balance sheet. Theoretically, a business can improve its earnings (and produce a lower P/E in the future) by investing in growth. That means taking on debt (or spending its cash).
While growth expenditure doesn't always pay off, the point is that it is a good option to have; but one that the P/E ratio ignores.
Valmont Industries's Balance Sheet
Net debt totals 15% of Valmont Industries's market cap. This could bring some additional risk, and reduce the number of investment options for management; worth remembering if you compare its P/E to businesses without debt.
The Bottom Line On Valmont Industries's P/E Ratio
Valmont Industries trades on a P/E ratio of 29.4, which is above its market average of 17.7. With modest debt but no EPS growth in the last year, it's fair to say the P/E implies some optimism about future earnings, from the market.
When the market is wrong about a stock, it gives savvy investors an opportunity. As value investor Benjamin Graham famously said, 'In the short run, the market is a voting machine but in the long run, it is a weighing machine.' So this free visualization of the analyst consensus on future earnings could help you make the right decision about whether to buy, sell, or hold.
Of course you might be able to find a better stock than Valmont Industries. So you may wish to see this free collection of other companies that have grown earnings strongly.
We aim to bring you long-term focused research analysis driven by fundamental data. Note that our analysis may not factor in the latest price-sensitive company announcements or qualitative material.
If you spot an error that warrants correction, please contact the editor at editorial-team@simplywallst.com. This article by Simply Wall St is general in nature. It does not constitute a recommendation to buy or sell any stock, and does not take account of your objectives, or your financial situation. Simply Wall St has no position in the stocks mentioned. Thank you for reading.
